Silicon Valley Bank Results Presentation Deck slide image

Silicon Valley Bank Results Presentation Deck

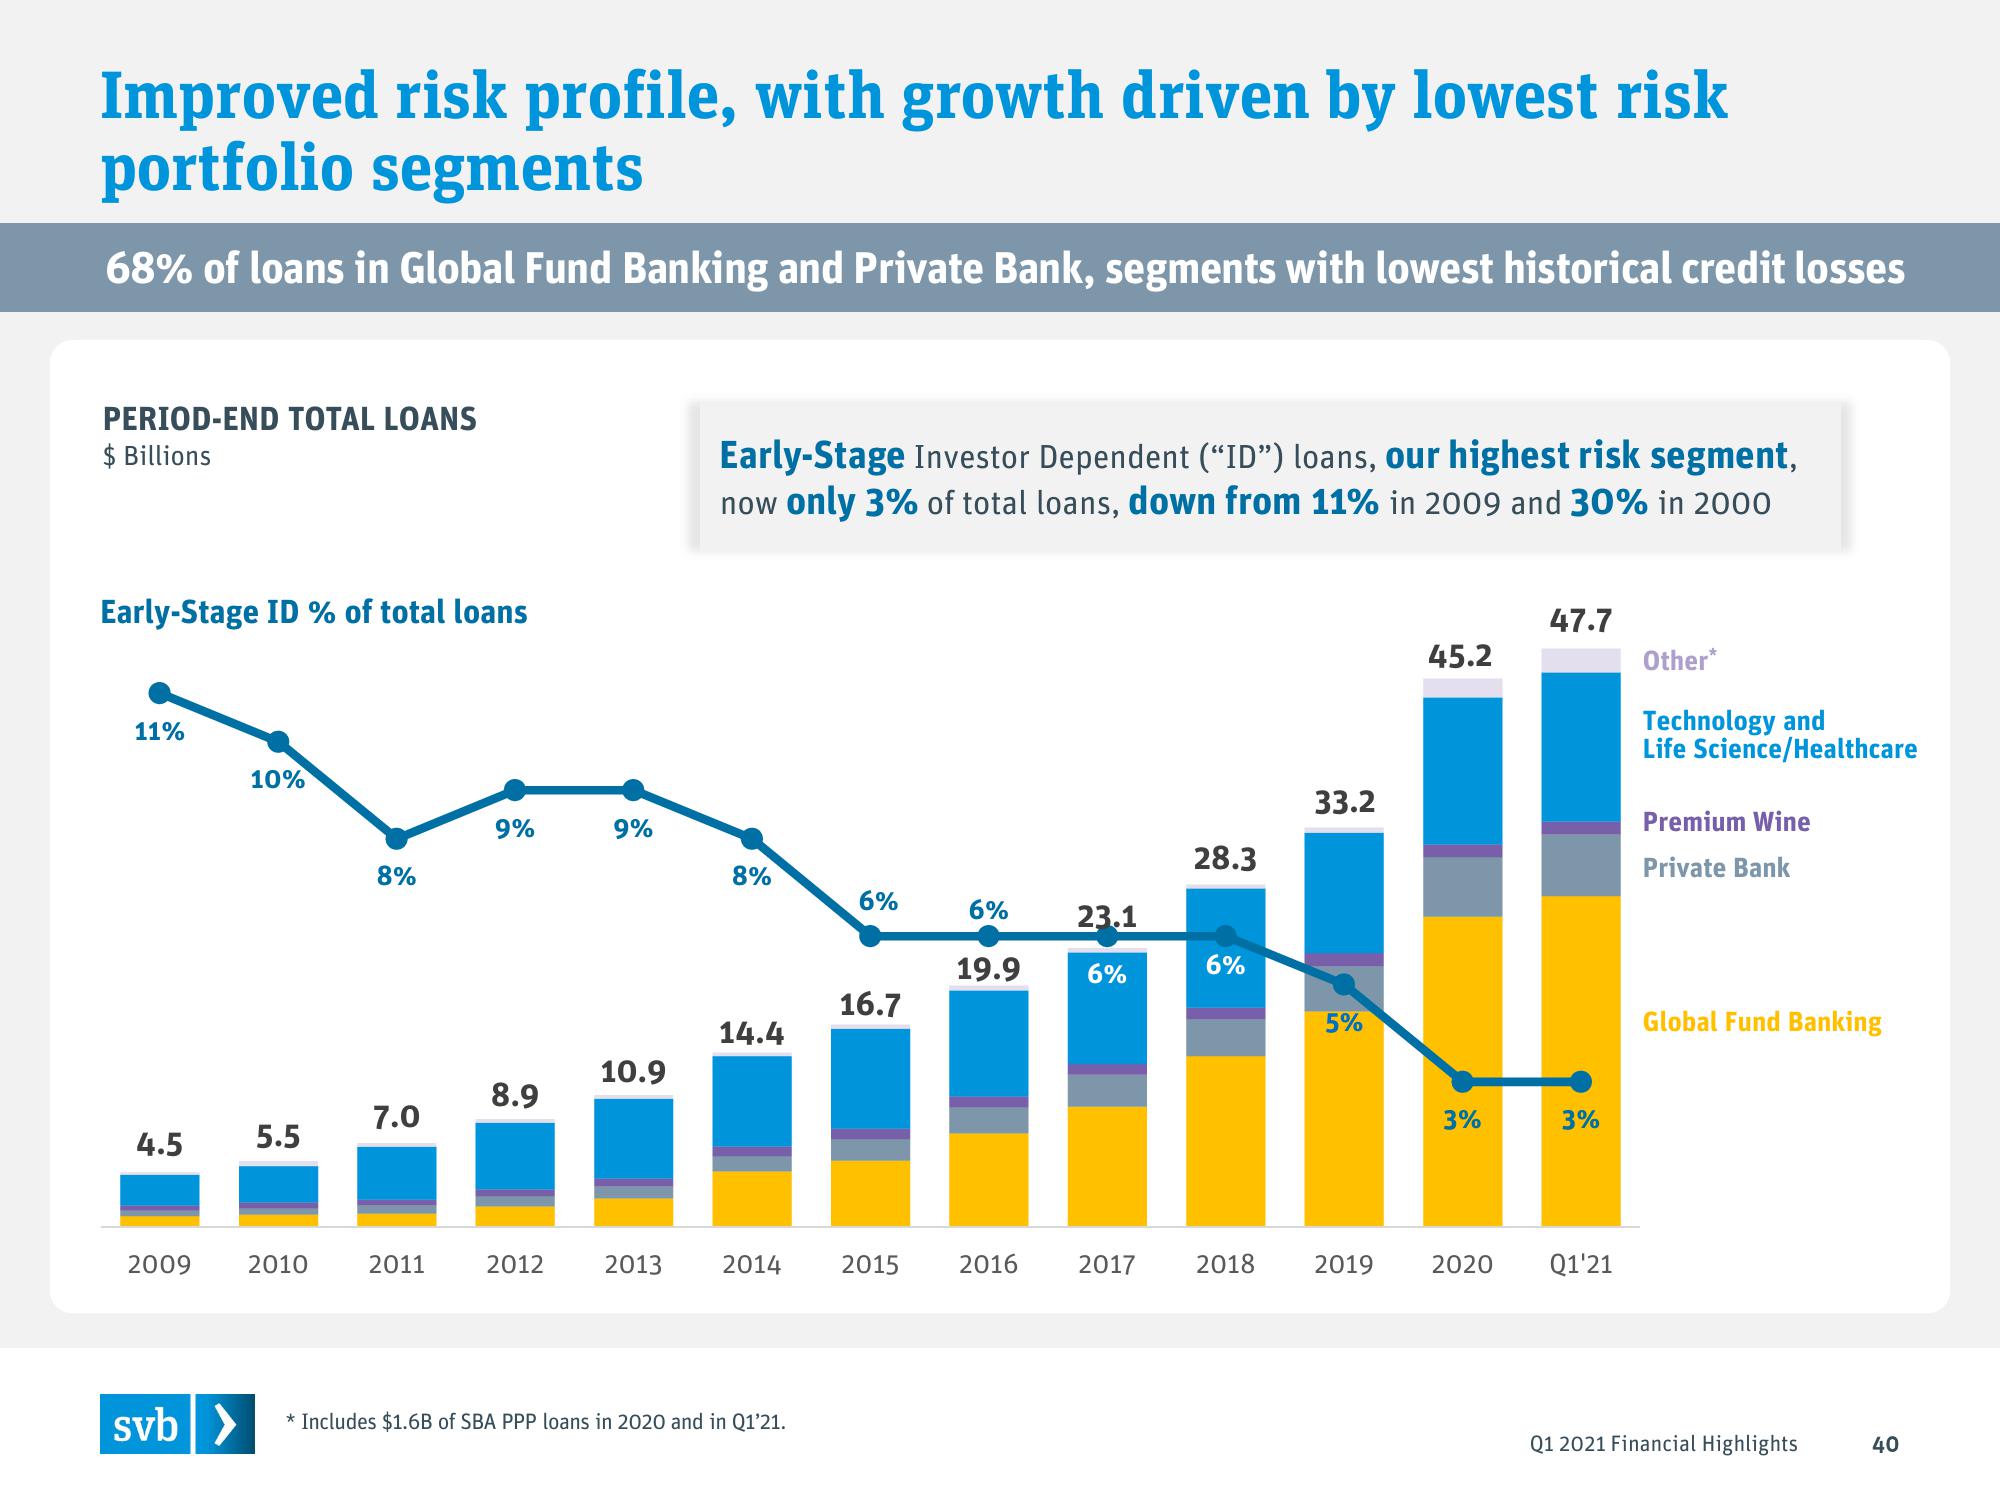
Improved risk profile, with growth driven by lowest risk portfolio segments 68% of loans in Global Fund Banking and Private Bank, segments with lowest historical credit losses PERIOD-END TOTAL LOANS $ Billions Early-Stage ID % of total loans 11% 4.5 2009 10% 5.5 2010 8% 7.0 2011 9% 8.9 2012 9% 10.9 Early-Stage Investor Dependent ("ID") loans, our highest risk segment, now only 3% of total loans, down from 11% in 2009 and 30% in 2000 8% 14.4 2013 2014 svb > * Includes $1.6B of SBA PPP loans in 2020 and in Q1'21. 6% 16.7 2015 6% 19.9 2016 23.1 6% 2017 28.3 6% 2018 33.2 5% 2019 45.2 3% 2020 47.7 3% Q1'21 Other* Technology and Life Science/Healthcare Premium Wine Private Bank Global Fund Banking Q1 2021 Financial Highlights 40
View entire presentation