Apollo Global Management Investor Presentation Deck
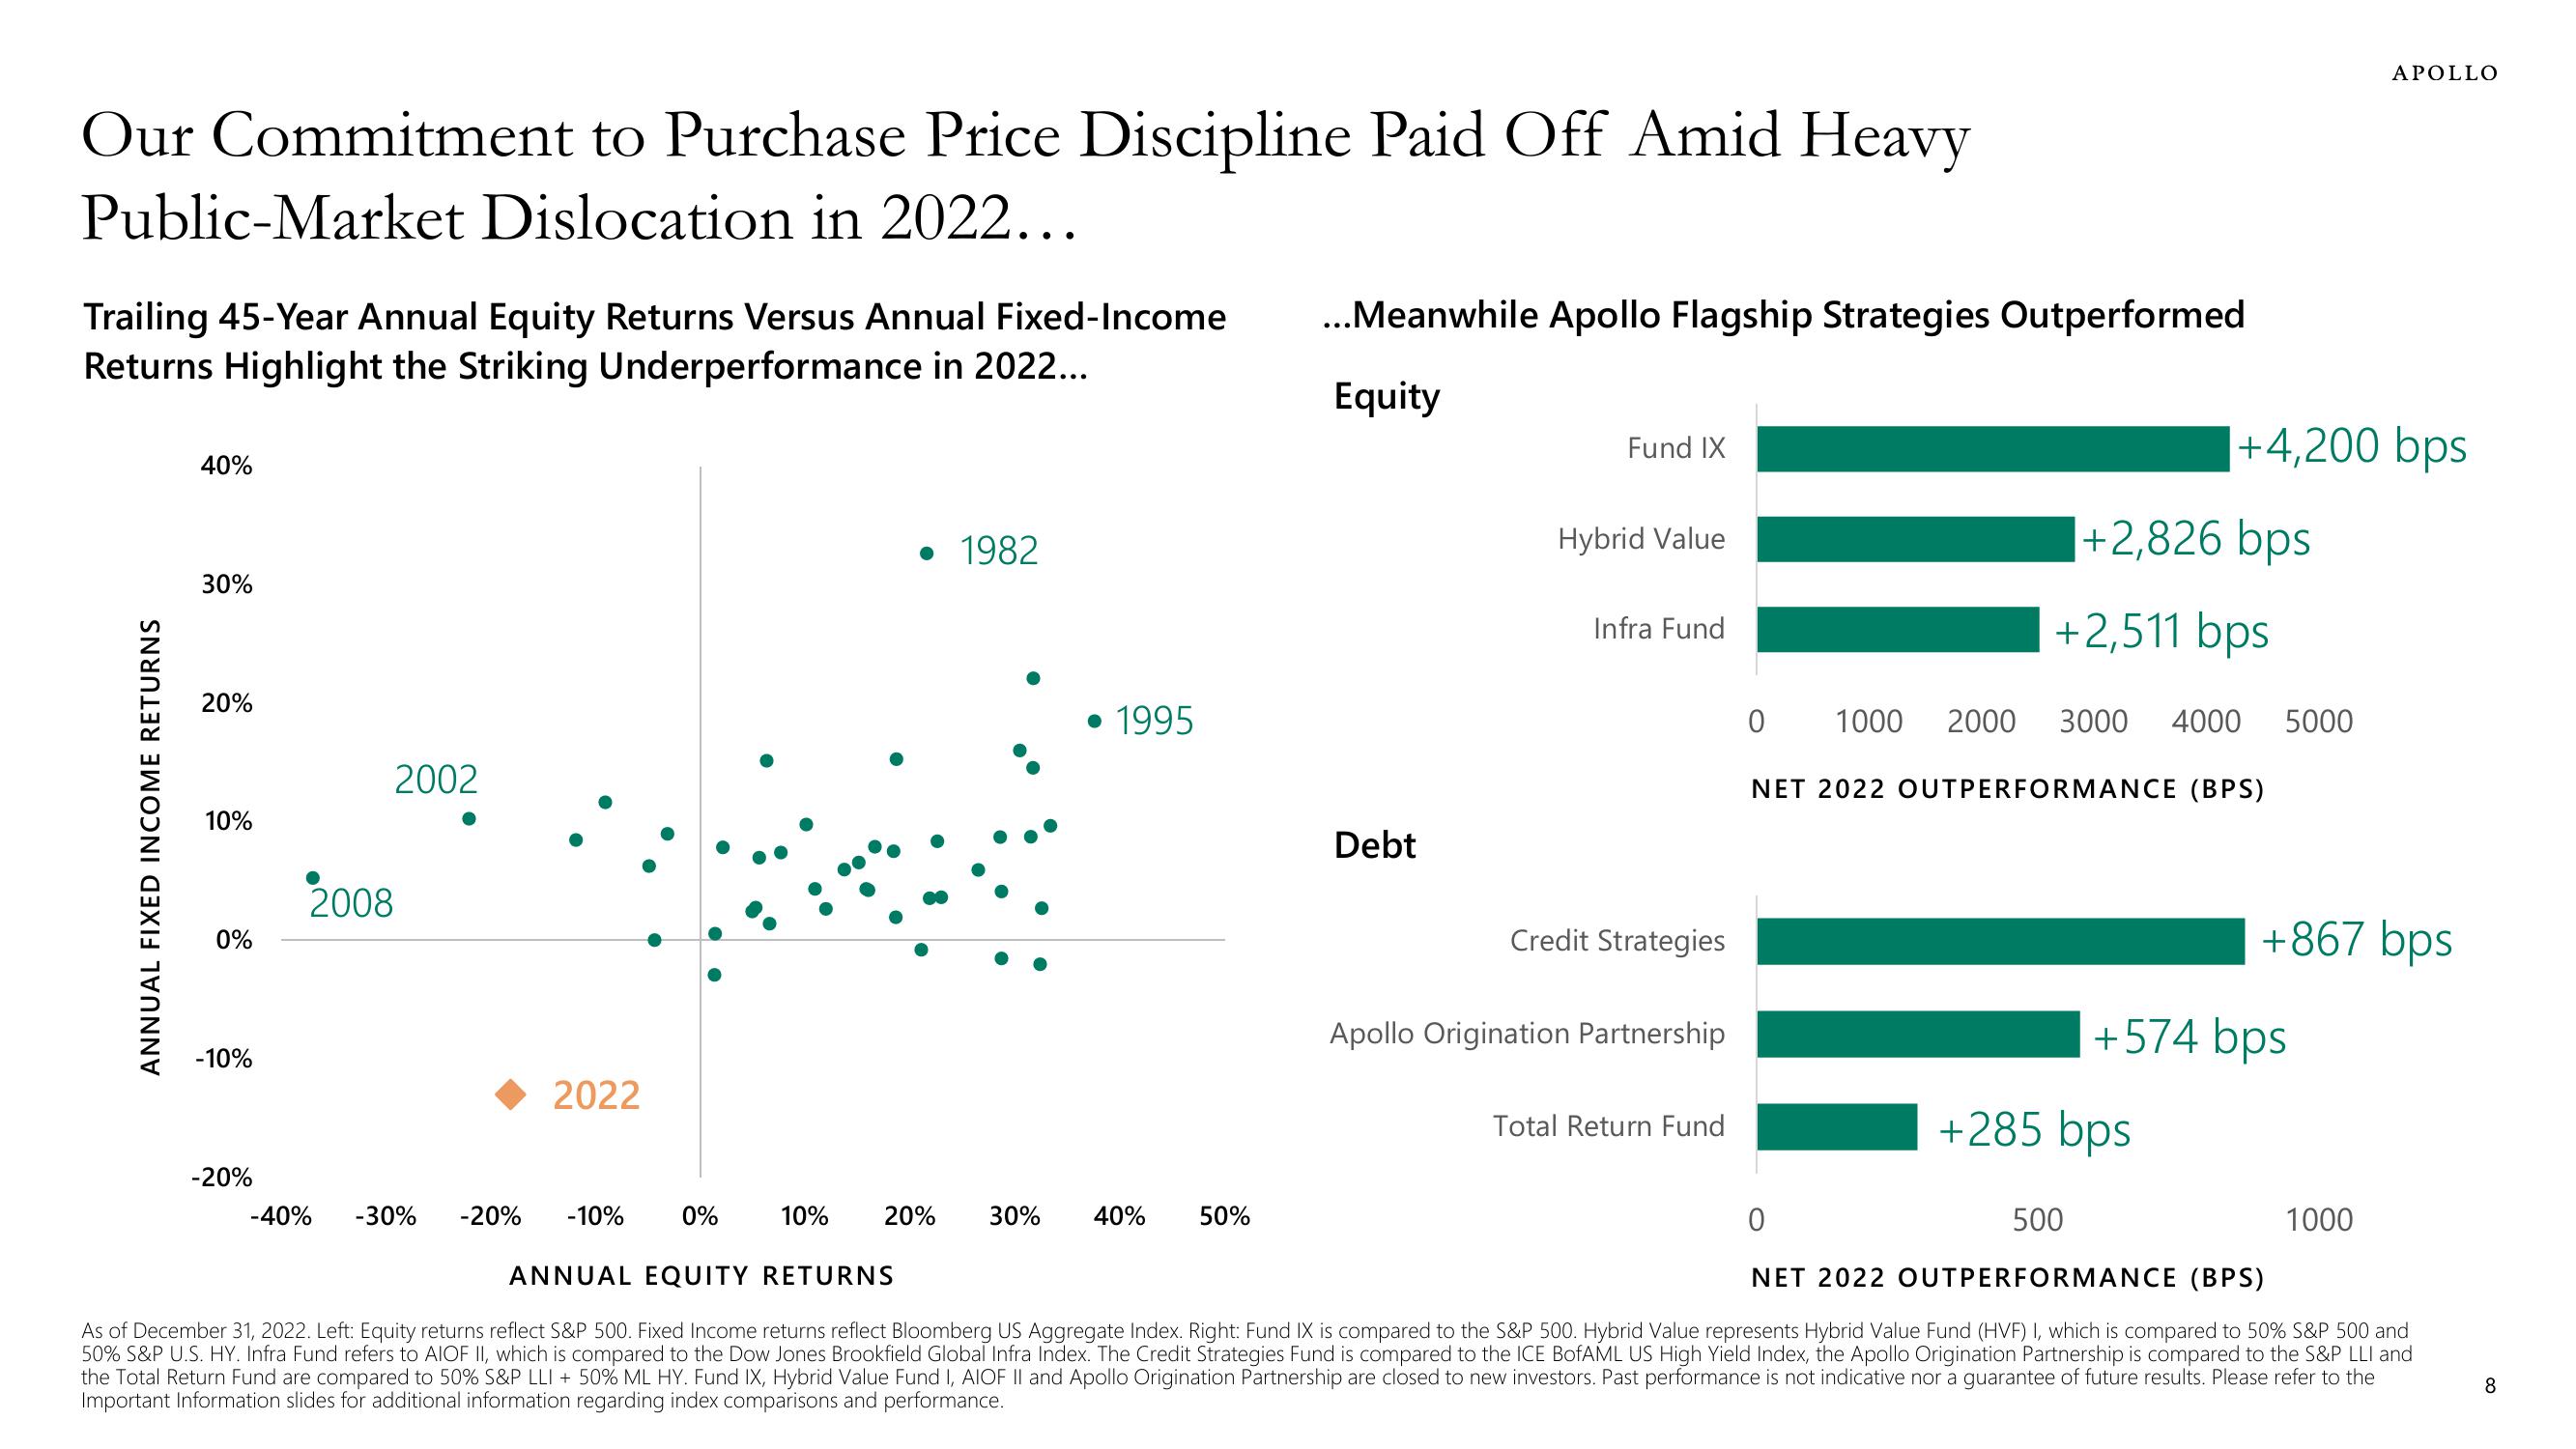
Our Commitment to Purchase Price Discipline Paid Off Amid Heavy
Public-Market Dislocation in 2022...
Trailing 45-Year Annual Equity Returns Versus Annual Fixed-Income
Returns Highlight the Striking Underperformance in 2022...
ANNUAL FIXED INCOME RETURNS
40%
30%
20%
10%
0%
-10%
-20%
2002
2008
-40%
2022
-30%
-20% -10%
0%
10%
1982
20%
• 1995
30%
...Meanwhile Apollo Flagship Strategies Outperformed
Equity
40% 50%
Debt
Fund IX
Hybrid Value
Infra Fund
Credit Strategies
Apollo Origination Partnership
Total Return Fund
0
500
ANNUAL EQUITY RETURNS
NET 2022 OUTPERFORMANCE (BPS)
As of December 31, 2022. Left: Equity returns reflect S&P 500. Fixed Income returns reflect Bloomberg US Aggregate Index. Right: Fund IX is compared to the S&P 500. Hybrid Value represents Hybrid Value Fund (HVF) I, which is compared to 50% S&P 500 and
50% S&P U.S. HY. Infra Fund refers to AIOF II, which is compared to the Dow Jones Brookfield Global Infra Index. The Credit Strategies Fund is compared to the ICE BofAML US High Yield Index, the Apollo Origination Partnership is compared to the S&P LLI and
the Total Return Fund are compared to 50% S&P LLI + 50% ML HY. Fund IX, Hybrid Value Fund I, AIOF II and Apollo Origination Partnership are closed to new investors. Past performance is not indicative nor a guarantee of future results. Please refer to the
Important Information slides for additional information regarding index comparisons and performance.
+4,200 bps
+2,826 bps
+2,511 bps
0 1000 2000 3000 4000 5000
NET 2022 OUTPERFORMANCE (BPS)
APOLLO
+867 bps
+574 bps
+285 bps
1000
8View entire presentation