Silicon Valley Bank Results Presentation Deck
Strong liquidity franchise
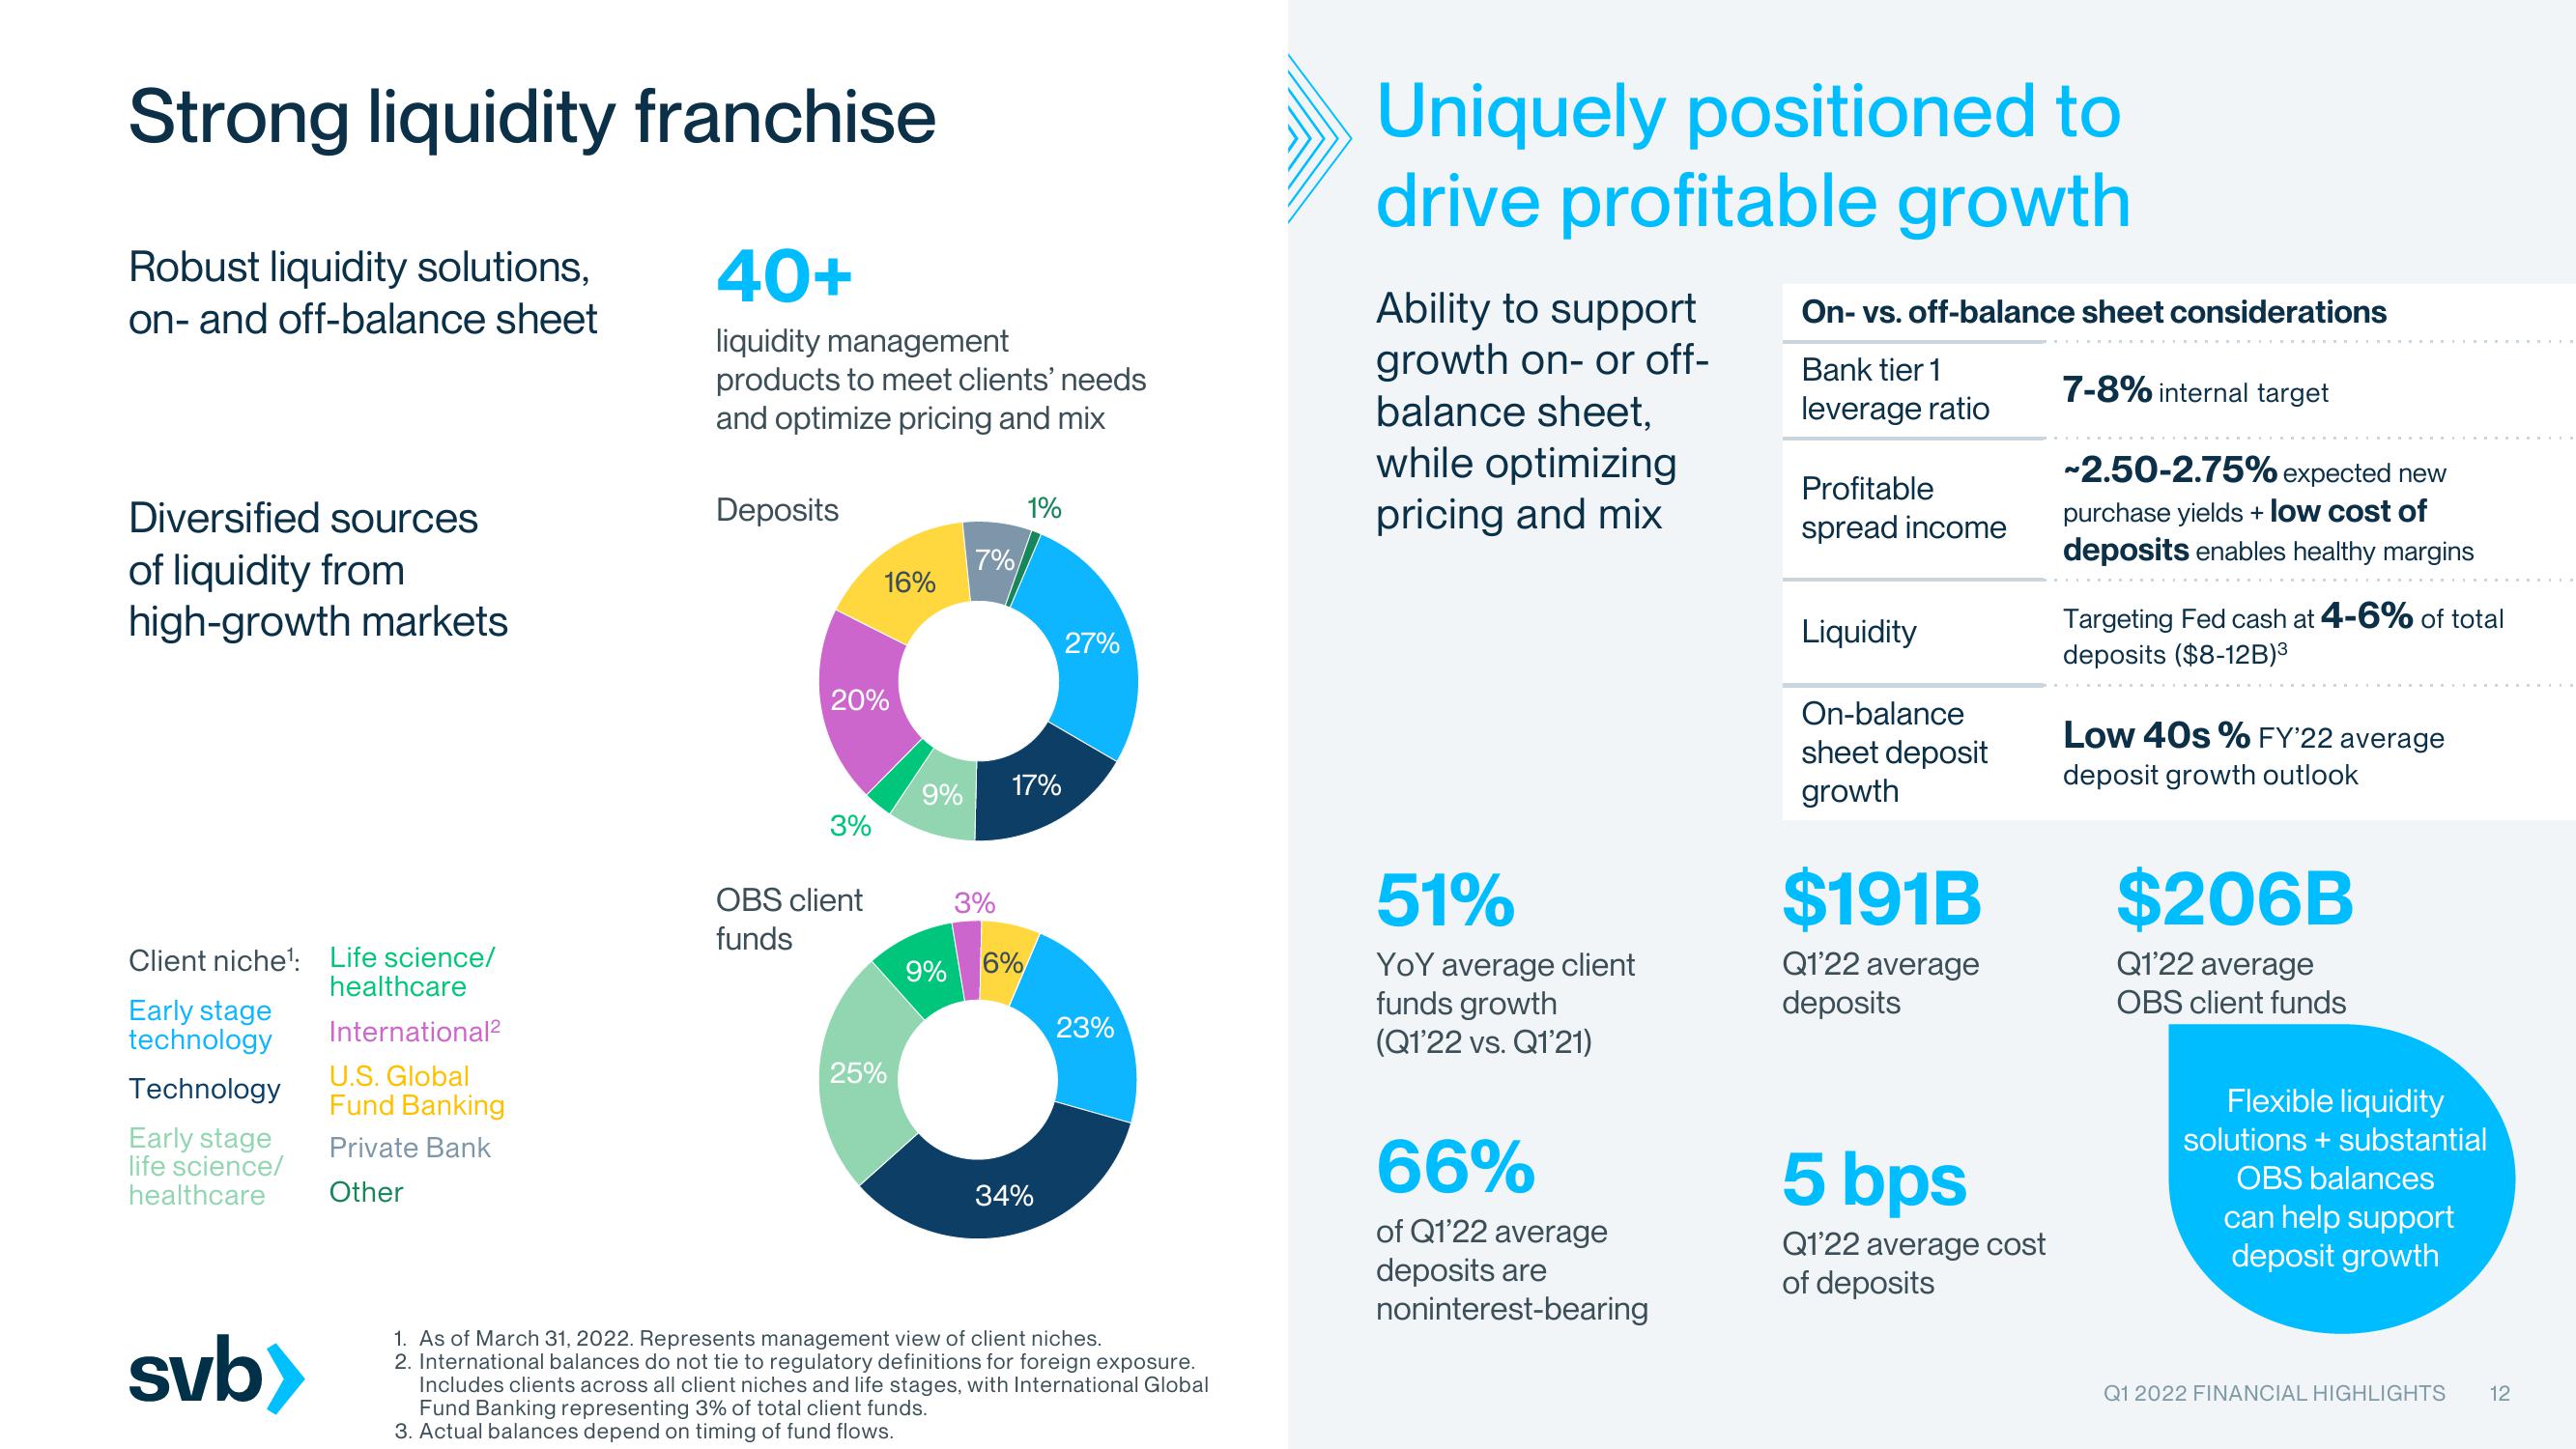
Robust liquidity solutions,
on- and off-balance sheet
40+
liquidity management
products to meet clients' needs
and optimize pricing and mix
Diversified sources
of liquidity from
high-growth markets
Client niche¹:
Early stage
technology
Technology
Early stage
life science/
healthcare
svb>
Life science/
healthcare
International²
U.S. Global
Fund Banking
Private Bank
Other
Deposits
20%
3%
16%
OBS client
funds
25%
9%
7%/
3%
1%
17%
9% 6%
34%
27%
23%
1. As of March 31, 2022. Represents management view of client niches.
2. International balances do not tie to regulatory definitions for foreign exposure.
Includes clients across all client niches and life stages, with International Global
Fund Banking representing 3% of total client funds.
3. Actual balances depend on timing of fund flows.
Uniquely positioned to
drive profitable growth
Ability to support
growth on- or off-
balance sheet,
while optimizing
pricing and mix
51%
YoY average client
funds growth
(Q1'22 vs. Q1'21)
66%
of Q1'22 average
deposits are
noninterest-bearing
On- vs. off-balance sheet considerations
Bank tier 1
leverage ratio
7-8% internal target
Profitable
spread income
Liquidity
On-balance
sheet deposit
growth
$191B
Q1'22 average
deposits
5 bps
Q1'22 average cost
of deposits
-2.50-2.75% expected new
purchase yields + low cost of
deposits enables healthy margins
Targeting Fed cash at 4-6% of total
deposits ($8-12B)³
Low 40s % FY'22 average
deposit growth outlook
$206B
Q1'22 average
OBS client funds
Flexible liquidity
solutions + substantial
OBS balances
can help support
deposit growth
Q1 2022 FINANCIAL HIGHLIGHTS
12View entire presentation