Silicon Valley Bank Results Presentation Deck
Continued momentum in fundraising and exits drove surge in client funds
Expect FY'21 average deposit % growth in the high 60s
●
●
●
●
●
●
Q1'21 activity
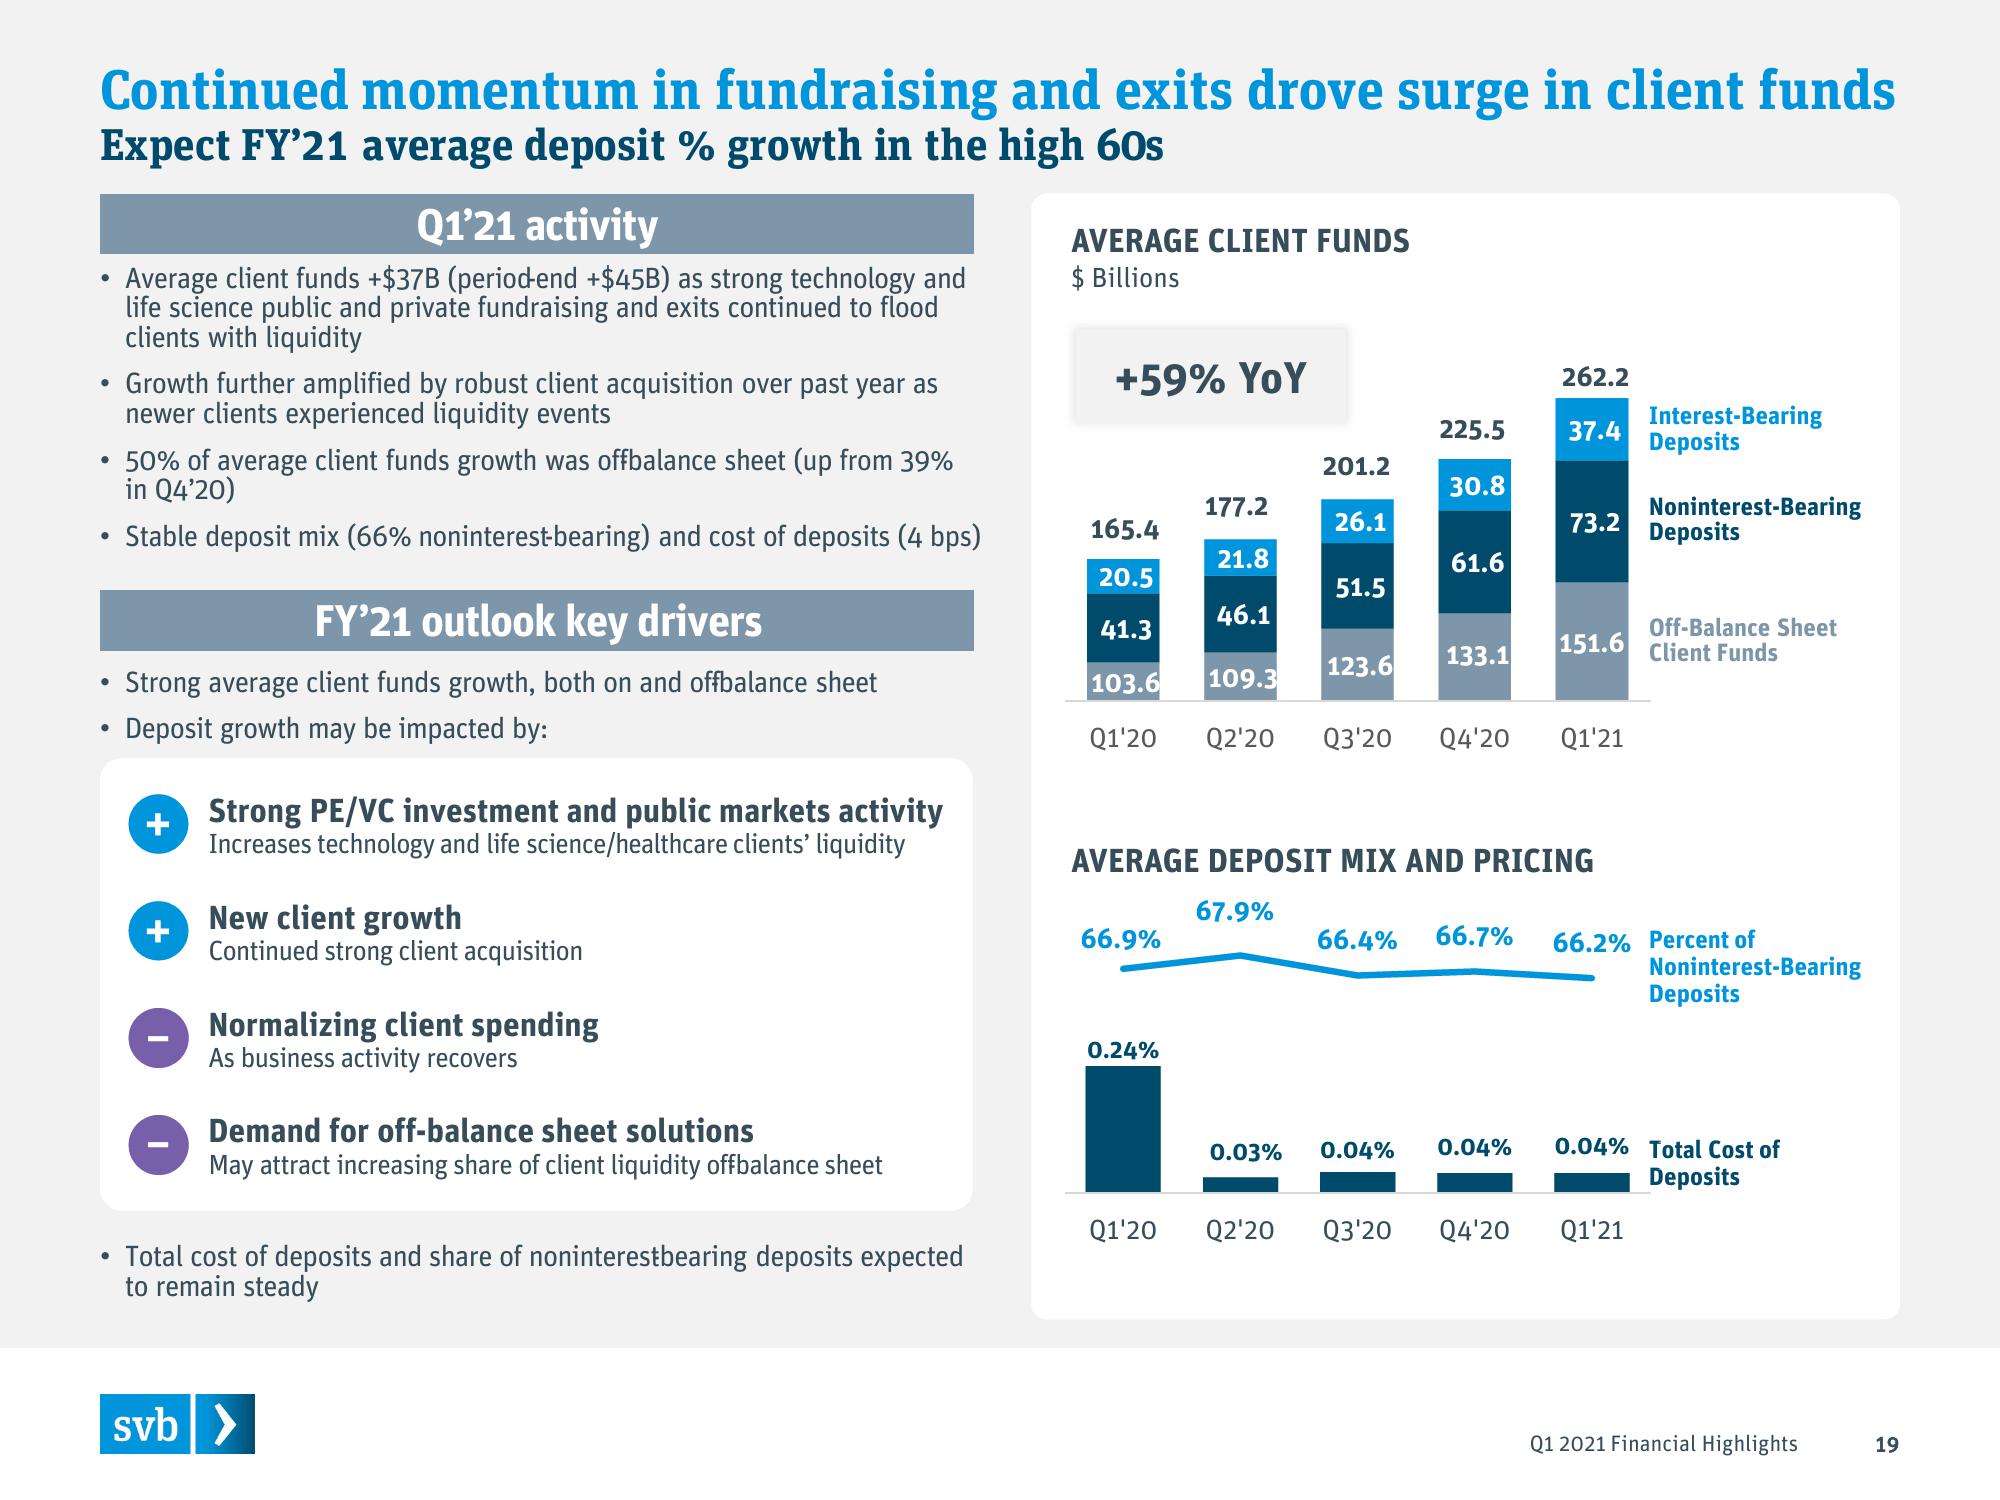
Average client funds +$37B (periodend +$45B) as strong technology and
life science public and private fundraising and exits continued to flood
clients with liquidity
Growth further amplified by robust client acquisition over past year as
newer clients experienced liquidity events
50% of average client funds growth was offbalance sheet (up from 39%
in Q4'20)
Stable deposit mix (66% noninterest-bearing) and cost of deposits (4 bps)
FY'21 outlook key drivers
Strong average client funds growth, both on and offbalance sheet
Deposit growth may be impacted by:
+
+
Strong PE/VC investment and public markets activity
Increases technology and life science/healthcare clients' liquidity
New client growth
Continued strong client acquisition
Normalizing client spending
As business activity recovers
Demand for off-balance sheet solutions
May attract increasing share of client liquidity offbalance sheet
Total cost of deposits and share of noninterestbearing deposits expected
to remain steady
svb >
AVERAGE CLIENT FUNDS
$ Billions
+59% YoY
165.4
20.5
41.3
103.6
Q1'20
66.9%
0.24%
177.2
21.8
Q1'20
46.1
109.3
201.2
26.1
51.5
123.6
225.5
30.8
61.6
0.03% 0.04%
133.1
Q2'20 Q3'20 Q4'20
AVERAGE DEPOSIT MIX AND PRICING
67.9%
66.4% 66.7%
262.2
37.4
0.04%
73.2
151.6
Q1'21
Interest-Bearing
Deposits
Noninterest-Bearing
Deposits
Q2'20 Q3'20 Q4'20 Q1'21
Off-Balance Sheet
Client Funds
66.2% Percent of
Noninterest-Bearing
Deposits
0.04% Total Cost of
Deposits
Q1 2021 Financial Highlights
19View entire presentation