Silicon Valley Bank Results Presentation Deck
Opportunistic investments and higher incentives from outstanding performance
caused Q4'21 expenses to exceed guidance; Expect FY'22 noninterest expense %
growth excluding merger-related charges in the low 20s
Q4'21 activity
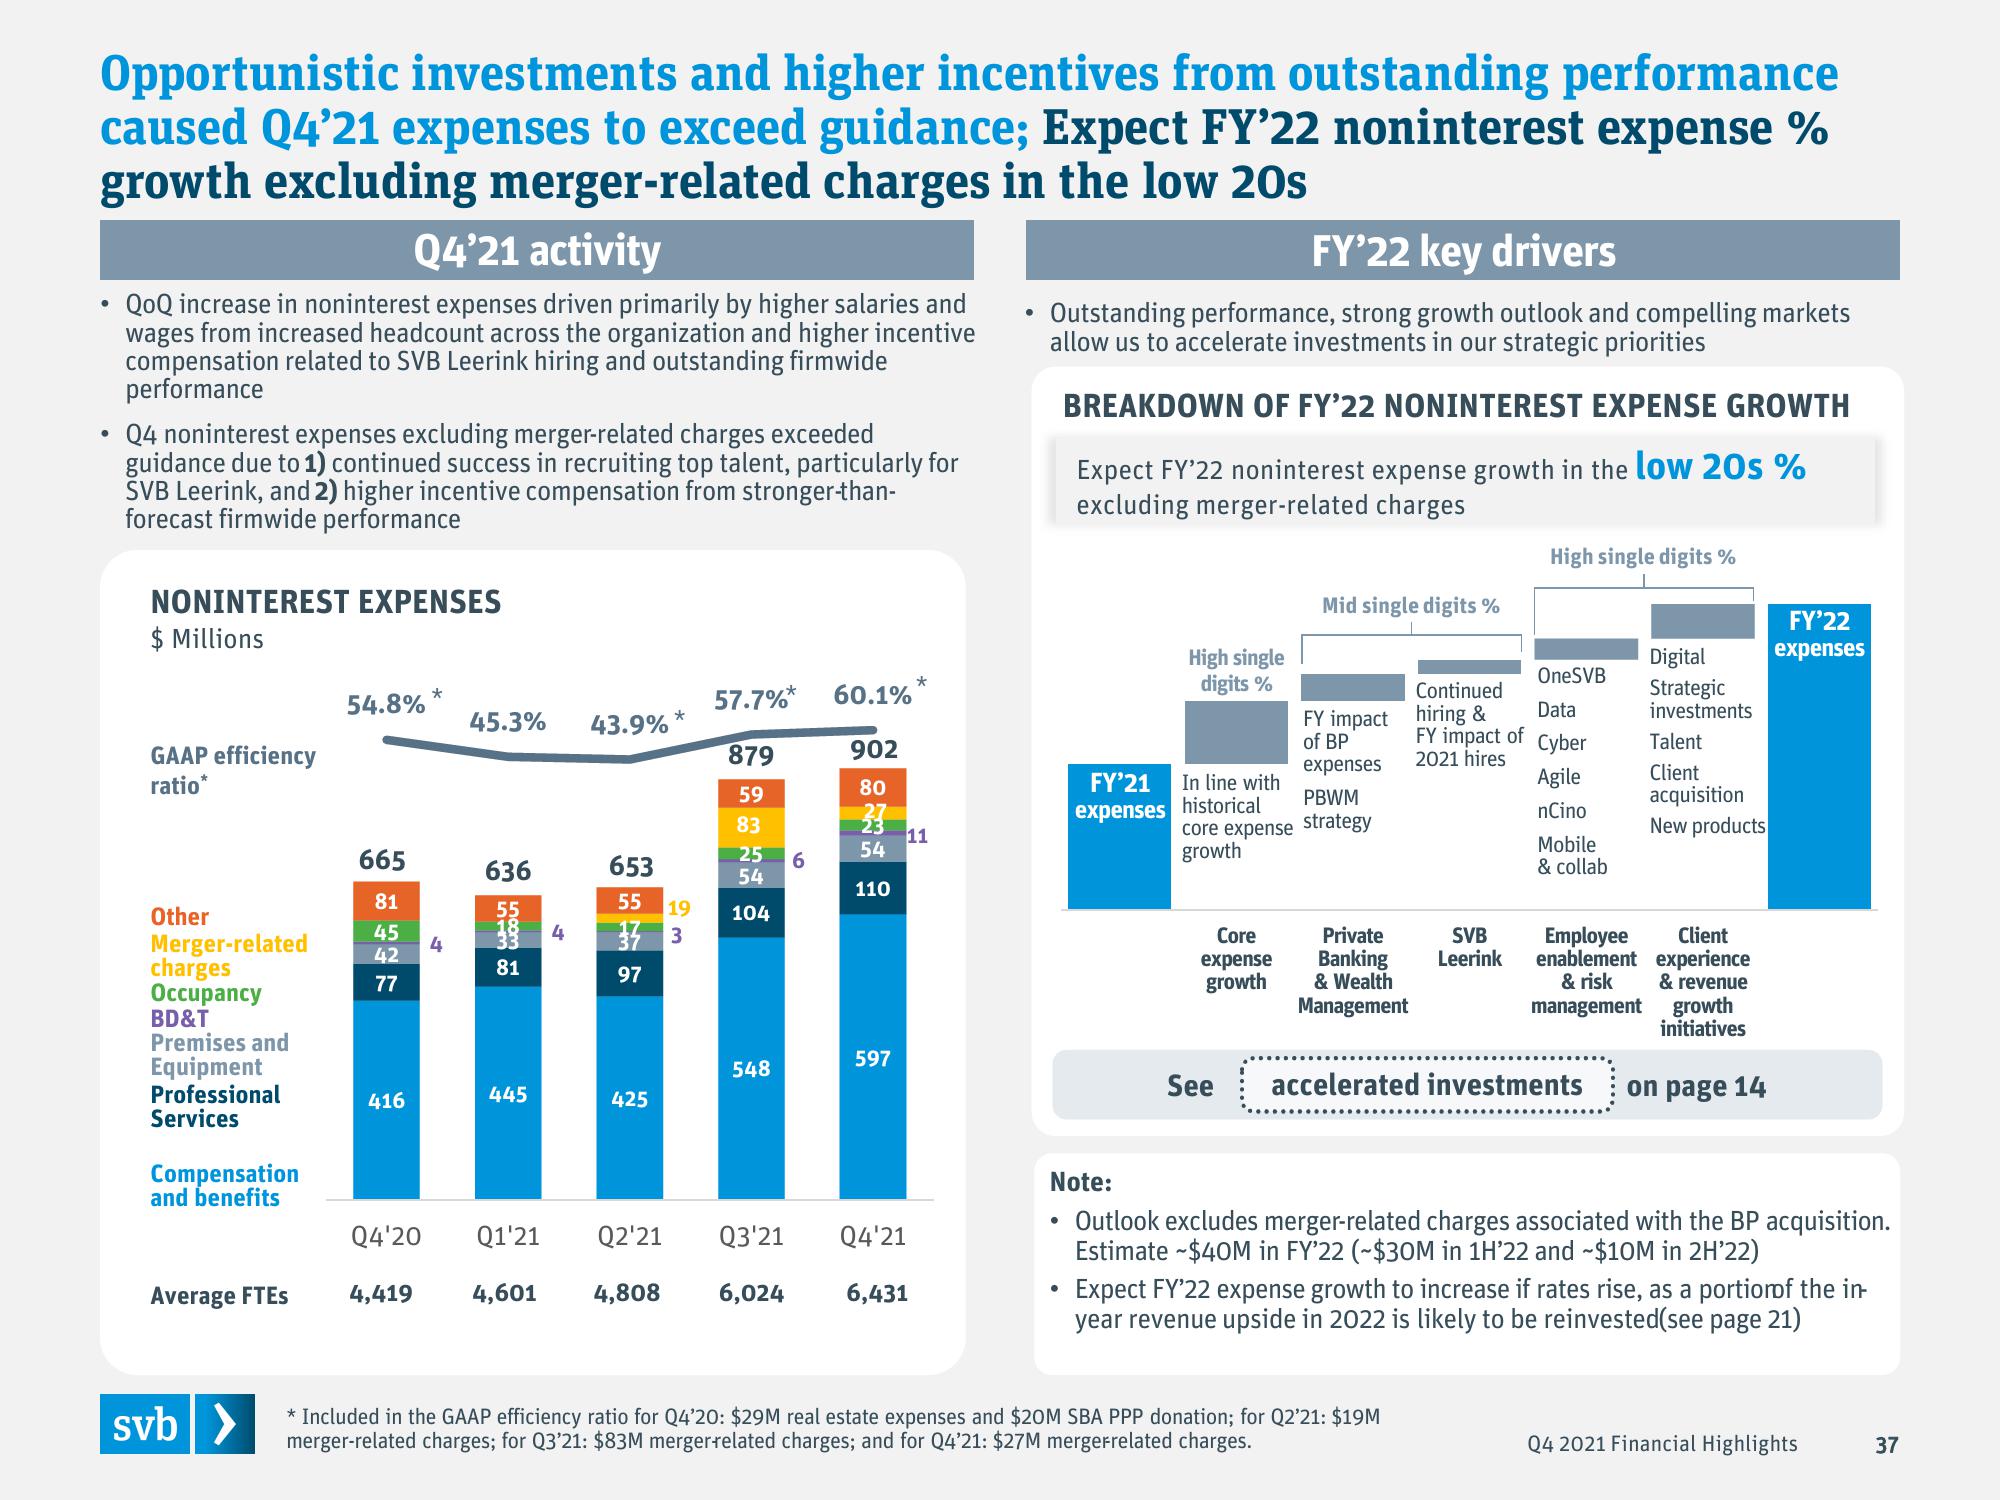
QoQ increase in noninterest expenses driven primarily by higher salaries and
wages from increased headcount across the organization and higher incentive
compensation related to SVB Leerink hiring and outstanding firmwide
performance
Q4 noninterest expenses excluding merger-related charges exceeded
guidance due to 1) continued success in recruiting top talent, particularly for
SVB Leerink, and 2) higher incentive compensation from stronger-than-
forecast firmwide performance
NONINTEREST EXPENSES
$ Millions
GAAP efficiency
ratio*
Other
Merger-related
charges
Occupancy
BD&T
Premises and
Equipment
Professional
Services
Compensation
and benefits
Average FTES
svb >
54.8% *
665
81
45
42
77
416
4
4,419
45.3% 43.9% *
636
55
LOOM
81
445
Q4'20 Q1'21
4
653
55
37 3
97
425
Q2'21
4,601 4,808
57.7%*
879
59
83
25
54
19 104
548
6
60.1%
902
80
23
54
110
597
*
11
Q3'21
Q4'21
6,024 6,431
●
FY'22 key drivers
Outstanding performance, strong growth outlook and compelling markets
allow us to accelerate investments in our strategic priorities
BREAKDOWN OF FY'22 NONINTEREST EXPENSE GROWTH
Expect FY'22 noninterest expense growth in the low 20s%
excluding merger-related charges
FY'21
expenses
●
High single
digits %
Continued
FY impact hiring &
of BP
expenses
PBWM
In line with
historical
core expense strategy
growth
Core
expense
growth
Mid single digits %
See
Private
Banking
& Wealth
Management
High single digits %
SVB
Leerink
OneSVB
Data
FY impact of Cyber
2021 hires
* Included in the GAAP efficiency ratio for Q4'20: $29M real estate expenses and $20M SBA PPP donation; for Q2'21: $19M
merger-related charges; for Q3'21: $83M mergerrelated charges; and for Q4'21: $27M mergerrelated charges.
Agile
nCino
Mobile
& collab
accelerated investments
Digital
Strategic
investments
Talent
Client
acquisition
New products
Client
Employee
enablement experience
& risk
management
& revenue
growth
initiatives
on page 14
Note:
• Outlook excludes merger-related charges associated with the BP acquisition.
Estimate $40M in FY'22 (~$30M in 1H'22 and ~$10M in 2H'22)
FY'22
expenses
Expect FY'22 expense growth to increase if rates rise, as a portion of the in
year revenue upside in 2022 is likely to be reinvested(see page 21)
Q4 2021 Financial Highlights
37View entire presentation