Wix Results Presentation Deck
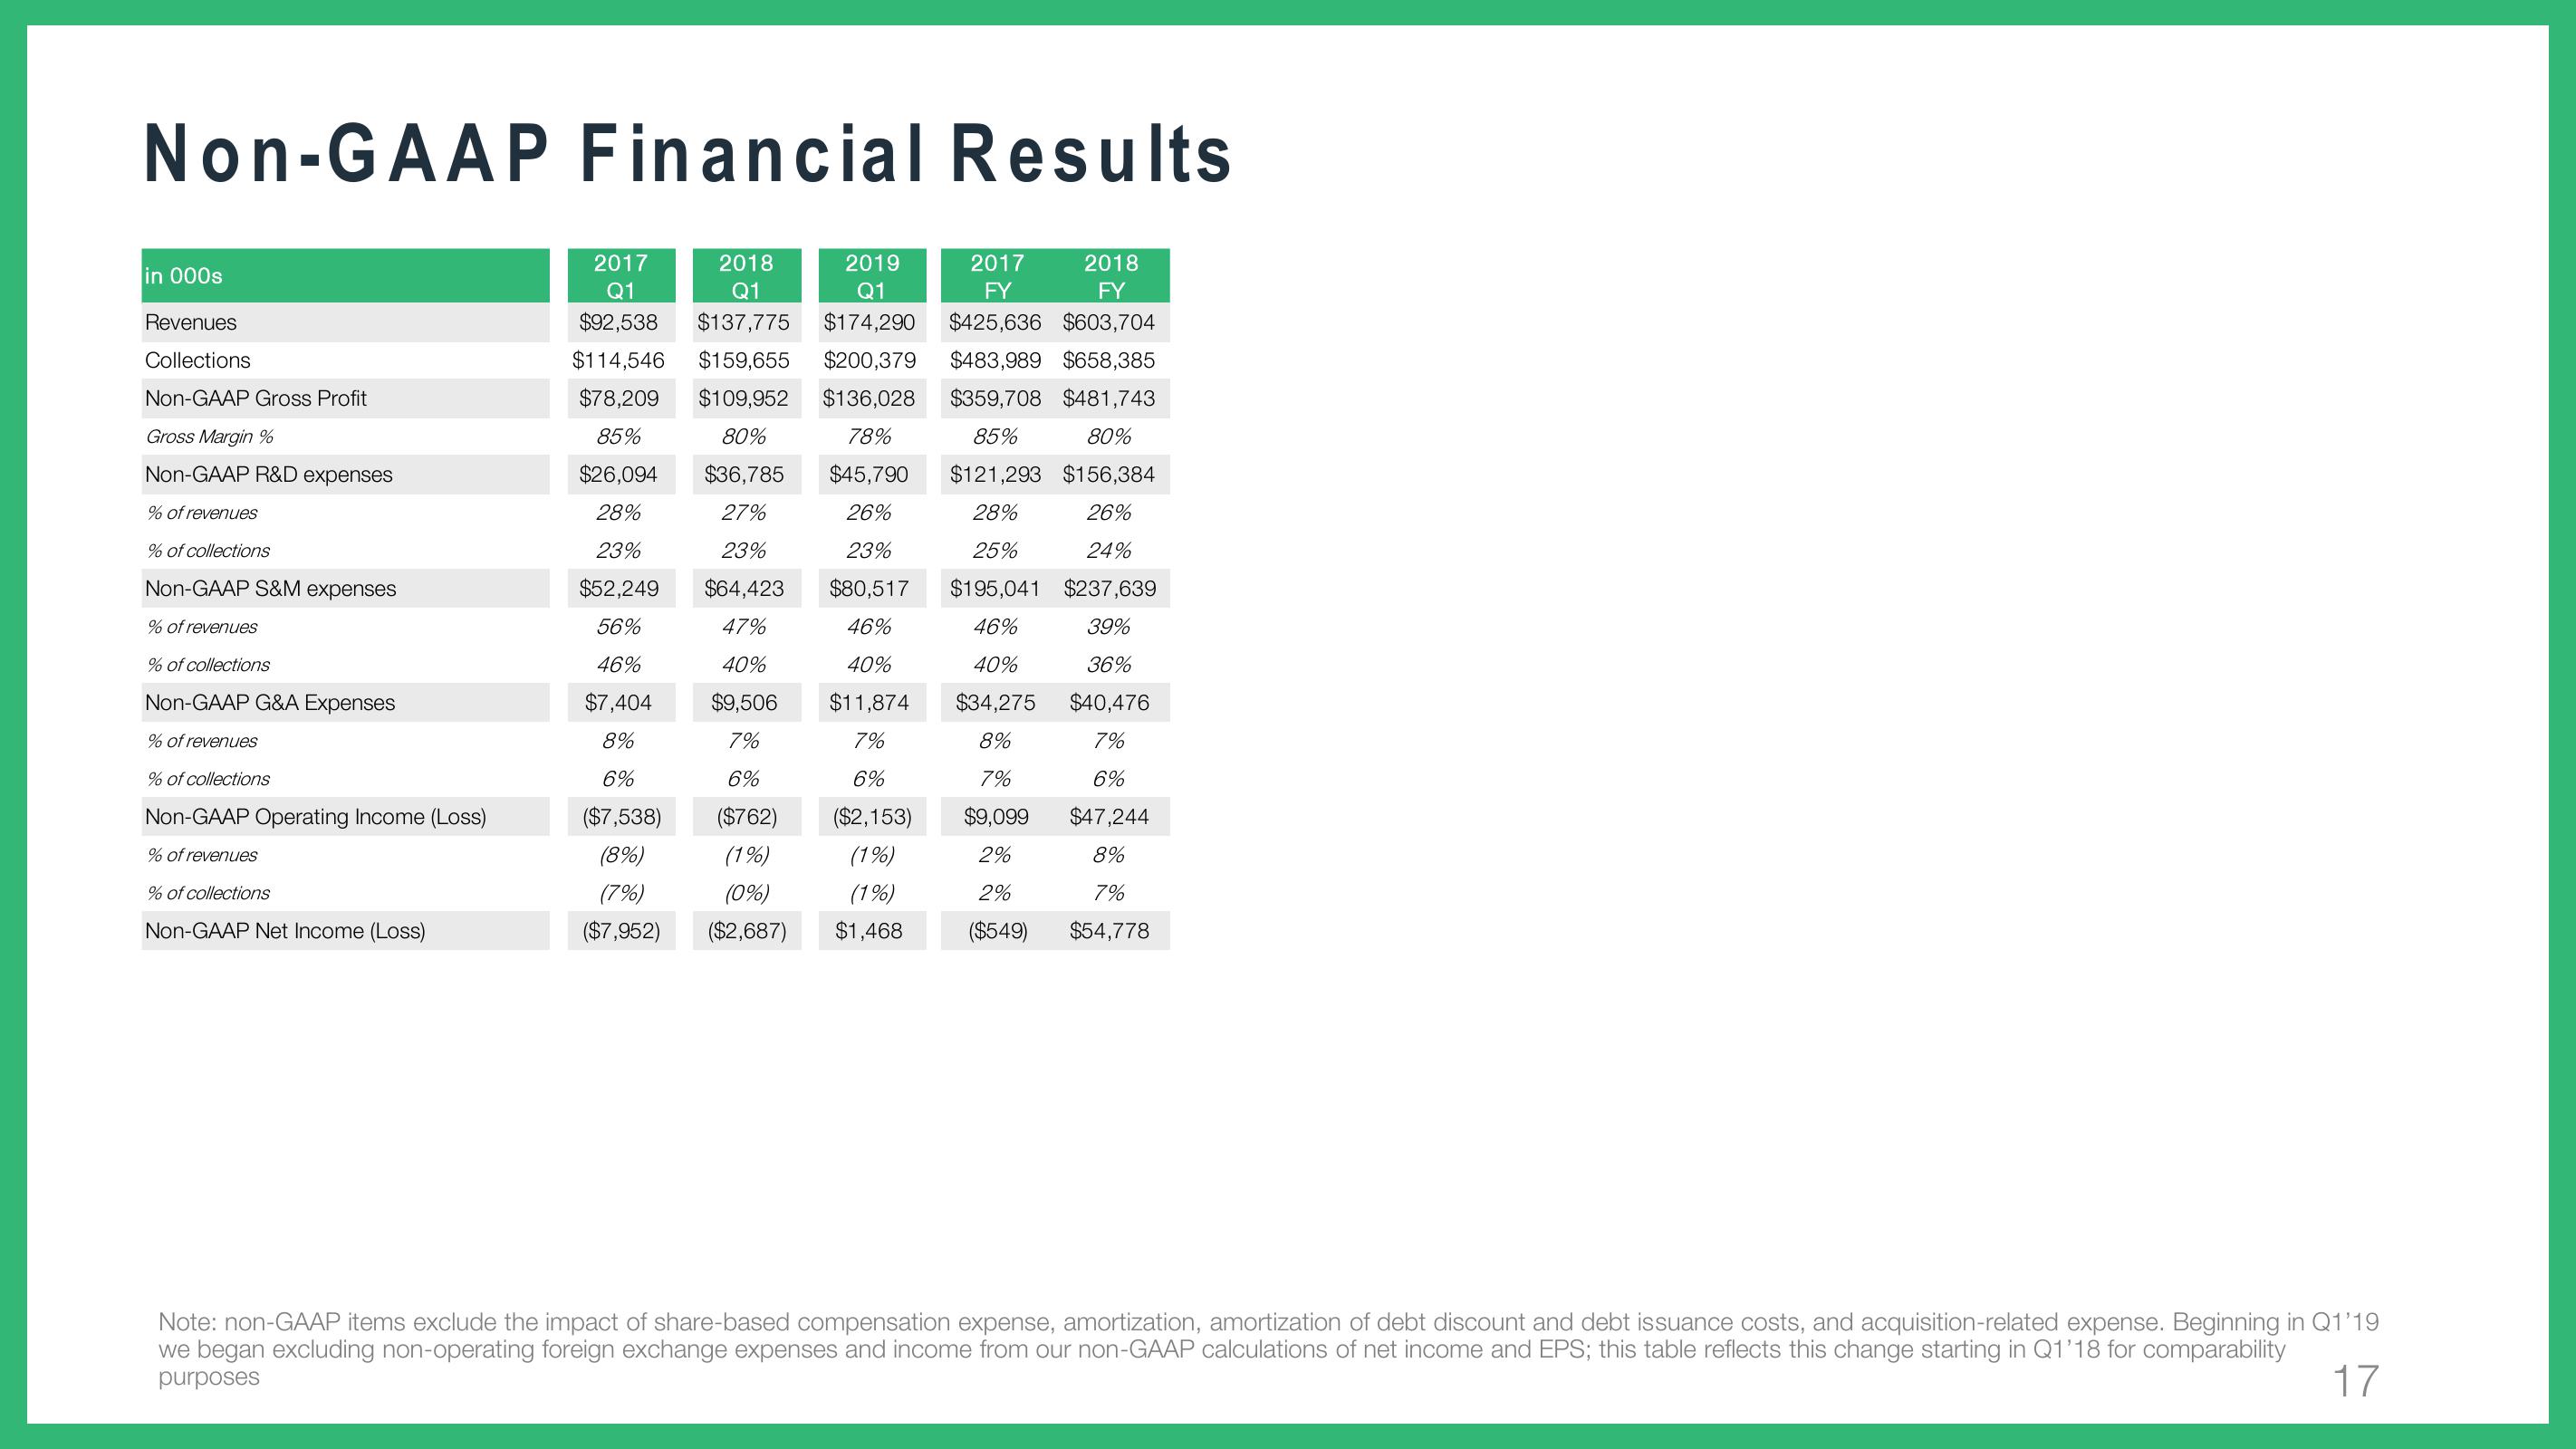
Non-GAAP Financial Results
2019
Q1
2017
FY
2018
FY
2017
2018
Q1
Q1
$92,538 $137,775 $174,290 $425,636 $603,704
$114,546 $159,655 $200,379 $483,989 $658,385
$78,209 $109,952 $136,028 $359,708 $481,743
85%
78%
85%
80%
$45,790 $121,293 $156,384
$26,094
80%
$36,785
27%
28%
28%
26%
23%
$52,249
23%
$64,423
26%
23%
$80,517
25%
$195,041
24%
$237,639
39%
56%
47%
46%
46%
46%
40%
40%
$7,404
$9,506
40%
$11,874
7%
$34,275
36%
$40,476
7%
8%
7%
8%
6%
6%
6%
($2,153)
7%
$9,099
($7,538)
($762)
6%
$47,244
8%
(8%)
(1%)
(1%)
2%
(7%)
(0%)
(1%)
2%
7%
($7,952)
($2,687) $1,468
($549)
$54,778
in 000s
Revenues
Collections
Non-GAAP Gross Profit
Gross Margin %
Non-GAAP R&D expenses
% of revenues
% of collections
Non-GAAP S&M expenses
% of revenues
% of collections
Non-GAAP G&A Expenses
% of revenues
% of collections
Non-GAAP Operating Income (Loss)
% of revenues
% of collections
Non-GAAP Net Income (Loss)
Note: non-GAAP items exclude the impact of share-based compensation expense, amortization, amortization of debt discount and debt issuance costs, and acquisition-related expense. Beginning in Q1'19
we began excluding non-operating foreign exchange expenses and income from our non-GAAP calculations of net income and EPS; this table reflects this change starting in Q1'18 for comparability
purposes
17View entire presentation