Xometry Mergers and Acquisitions Presentation Deck
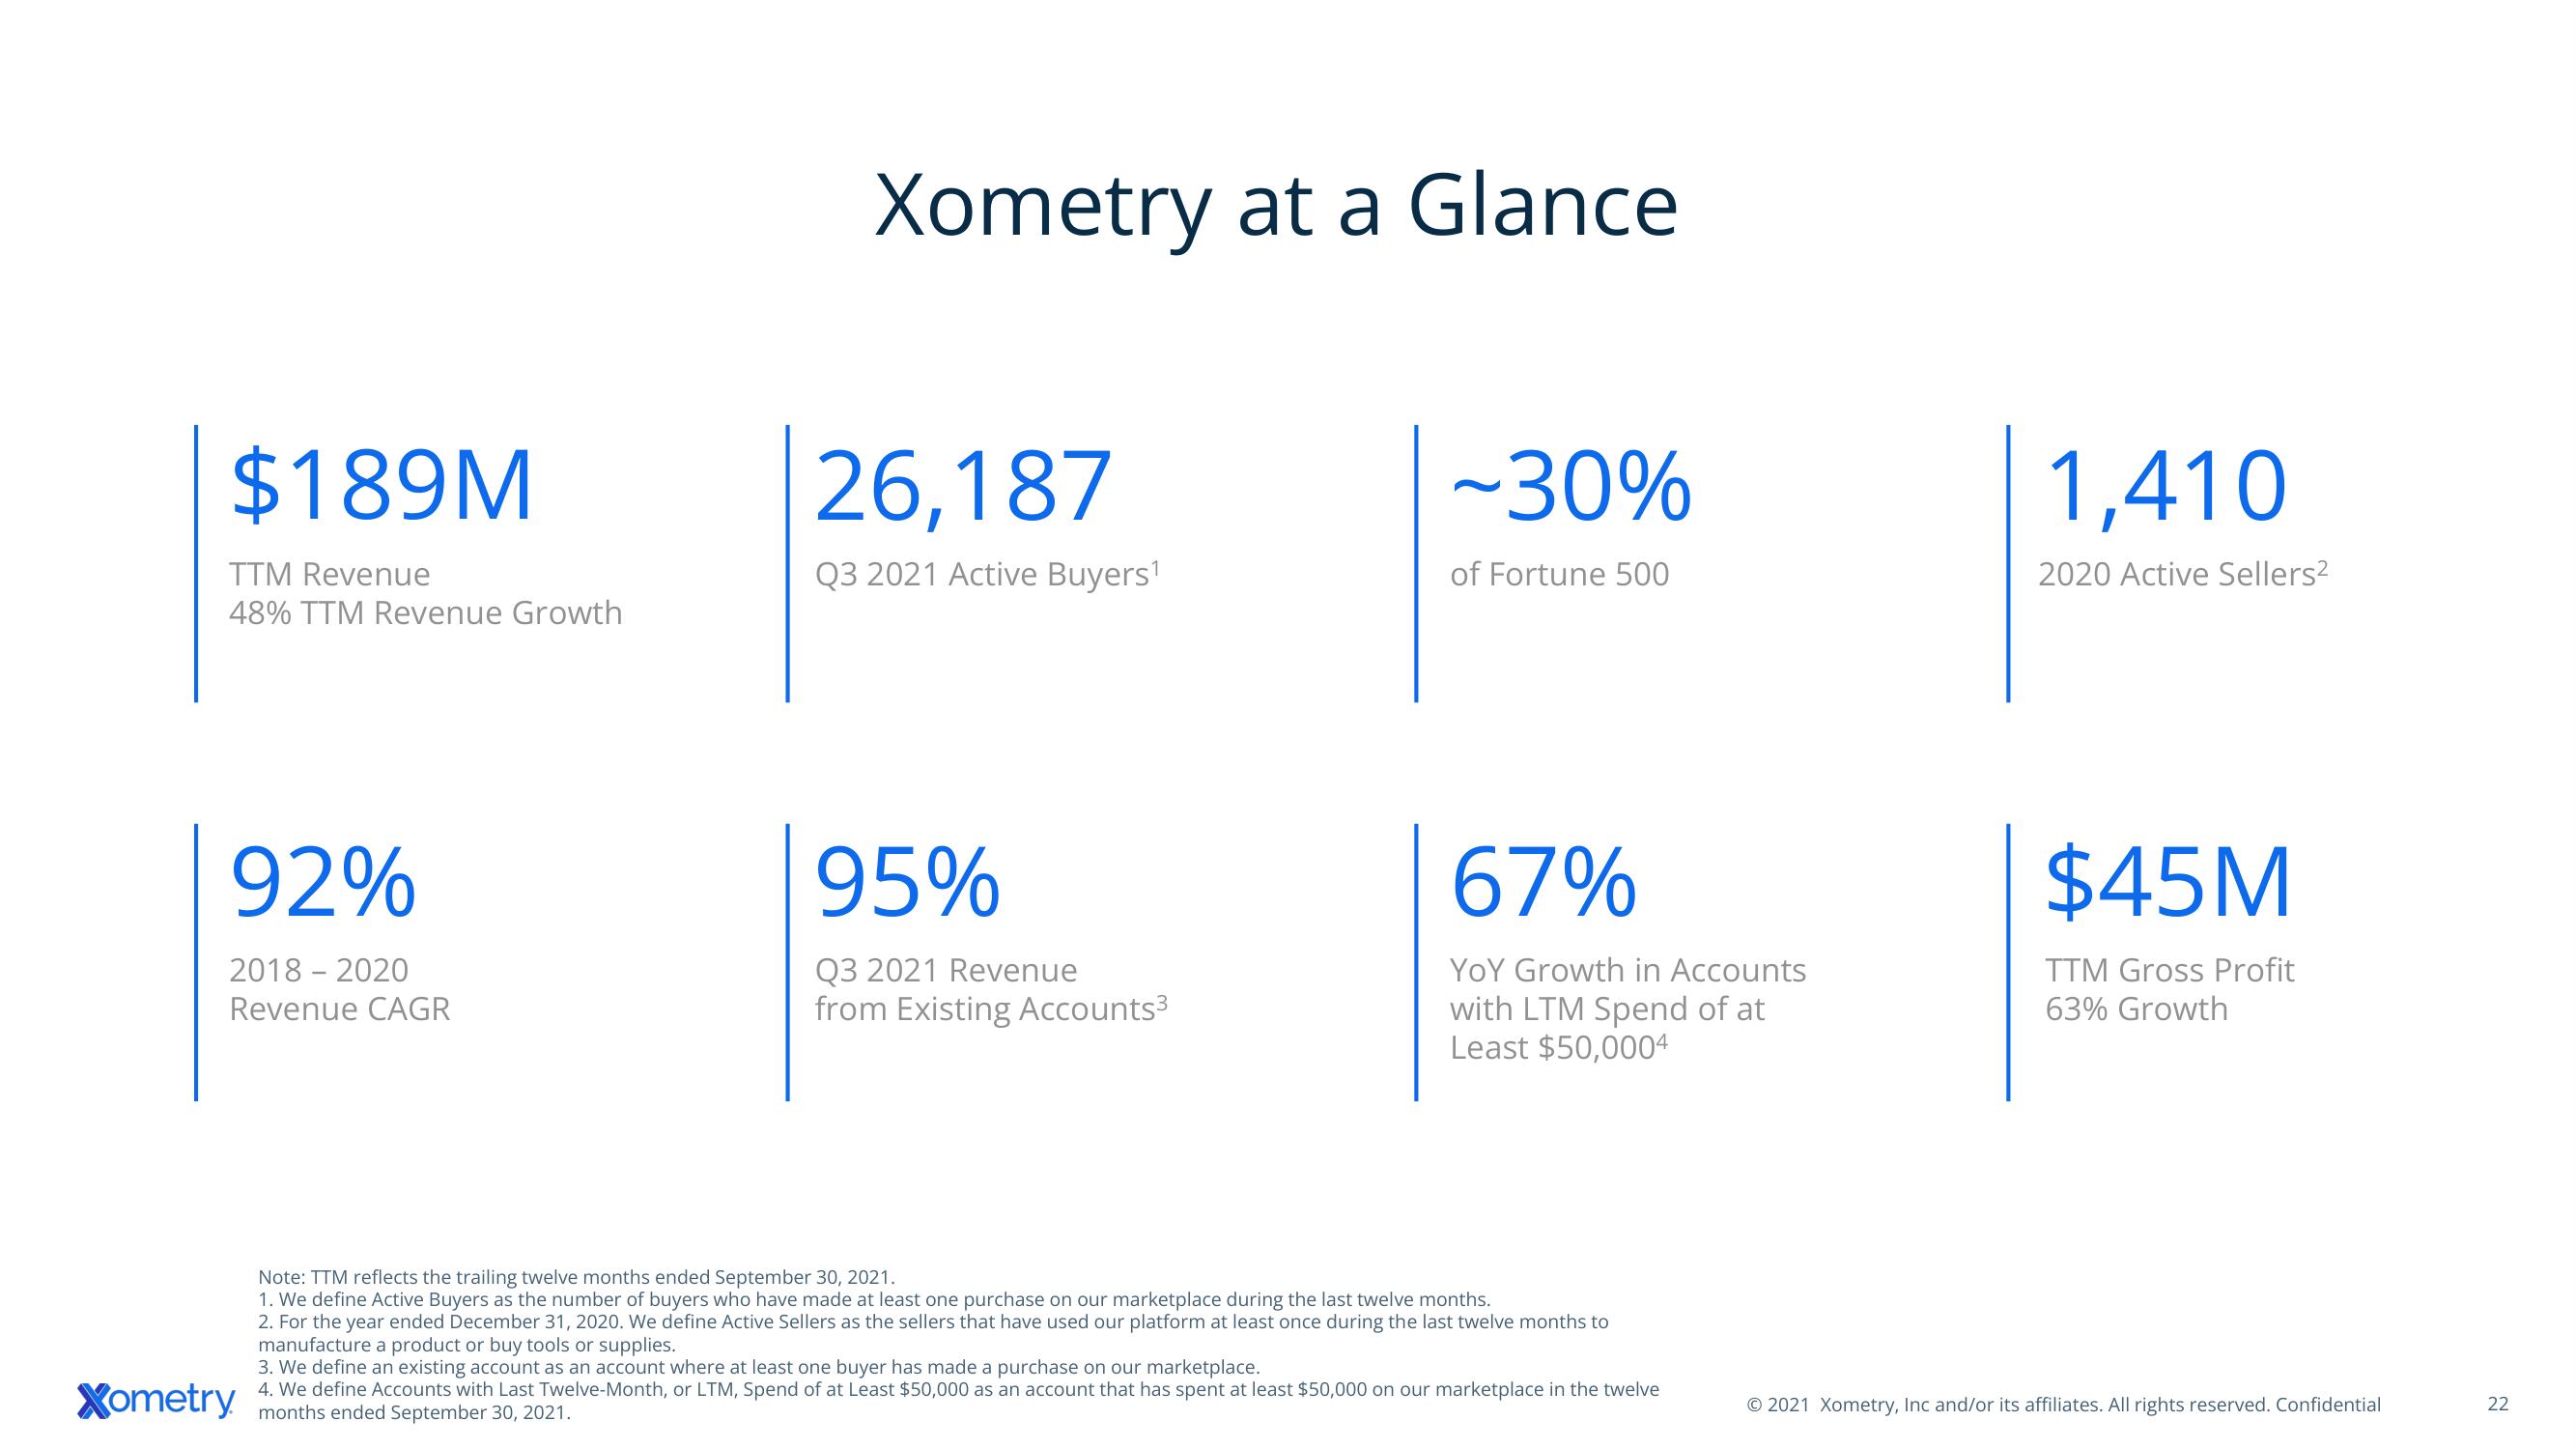
$189M
TTM Revenue
48% TTM Revenue Growth
92%
2018 - 2020
Revenue CAGR
Xometry at a Glance
Xometry months ended September 30, 2021.
26,187
Q3 2021 Active Buyers¹
95%
Q3 2021 Revenue
from Existing Accounts³
-30%
of Fortune 500
67%
YOY Growth in Accounts
with LTM Spend of at
Least $50,0004
Note: TTM reflects the trailing twelve months ended September 30, 2021.
1. We define Active Buyers as the number of buyers who have made at least one purchase on our marketplace during the last twelve months.
2. For the year ended December 31, 2020. We define Active Sellers as the sellers that have used our platform at least once during the last twelve months to
manufacture a product or buy tools or supplies.
3. We define an existing account as an account where at least one buyer has made a purchase on our marketplace.
4. We define Accounts with Last Twelve-Month, or LTM, Spend of at Least $50,000 as an account that has spent at least $50,000 on our marketplace in the twelve
1,410
2020 Active Sellers²
$45M
TTM Gross Profit
63% Growth
© 2021 Xometry, Inc and/or its affiliates. All rights reserved. Confidential
22View entire presentation