Silicon Valley Bank Results Presentation Deck
Raised 2022 revenue outlook given current higher rate environment - additional
potential upside if rates increase
Outlook considerations
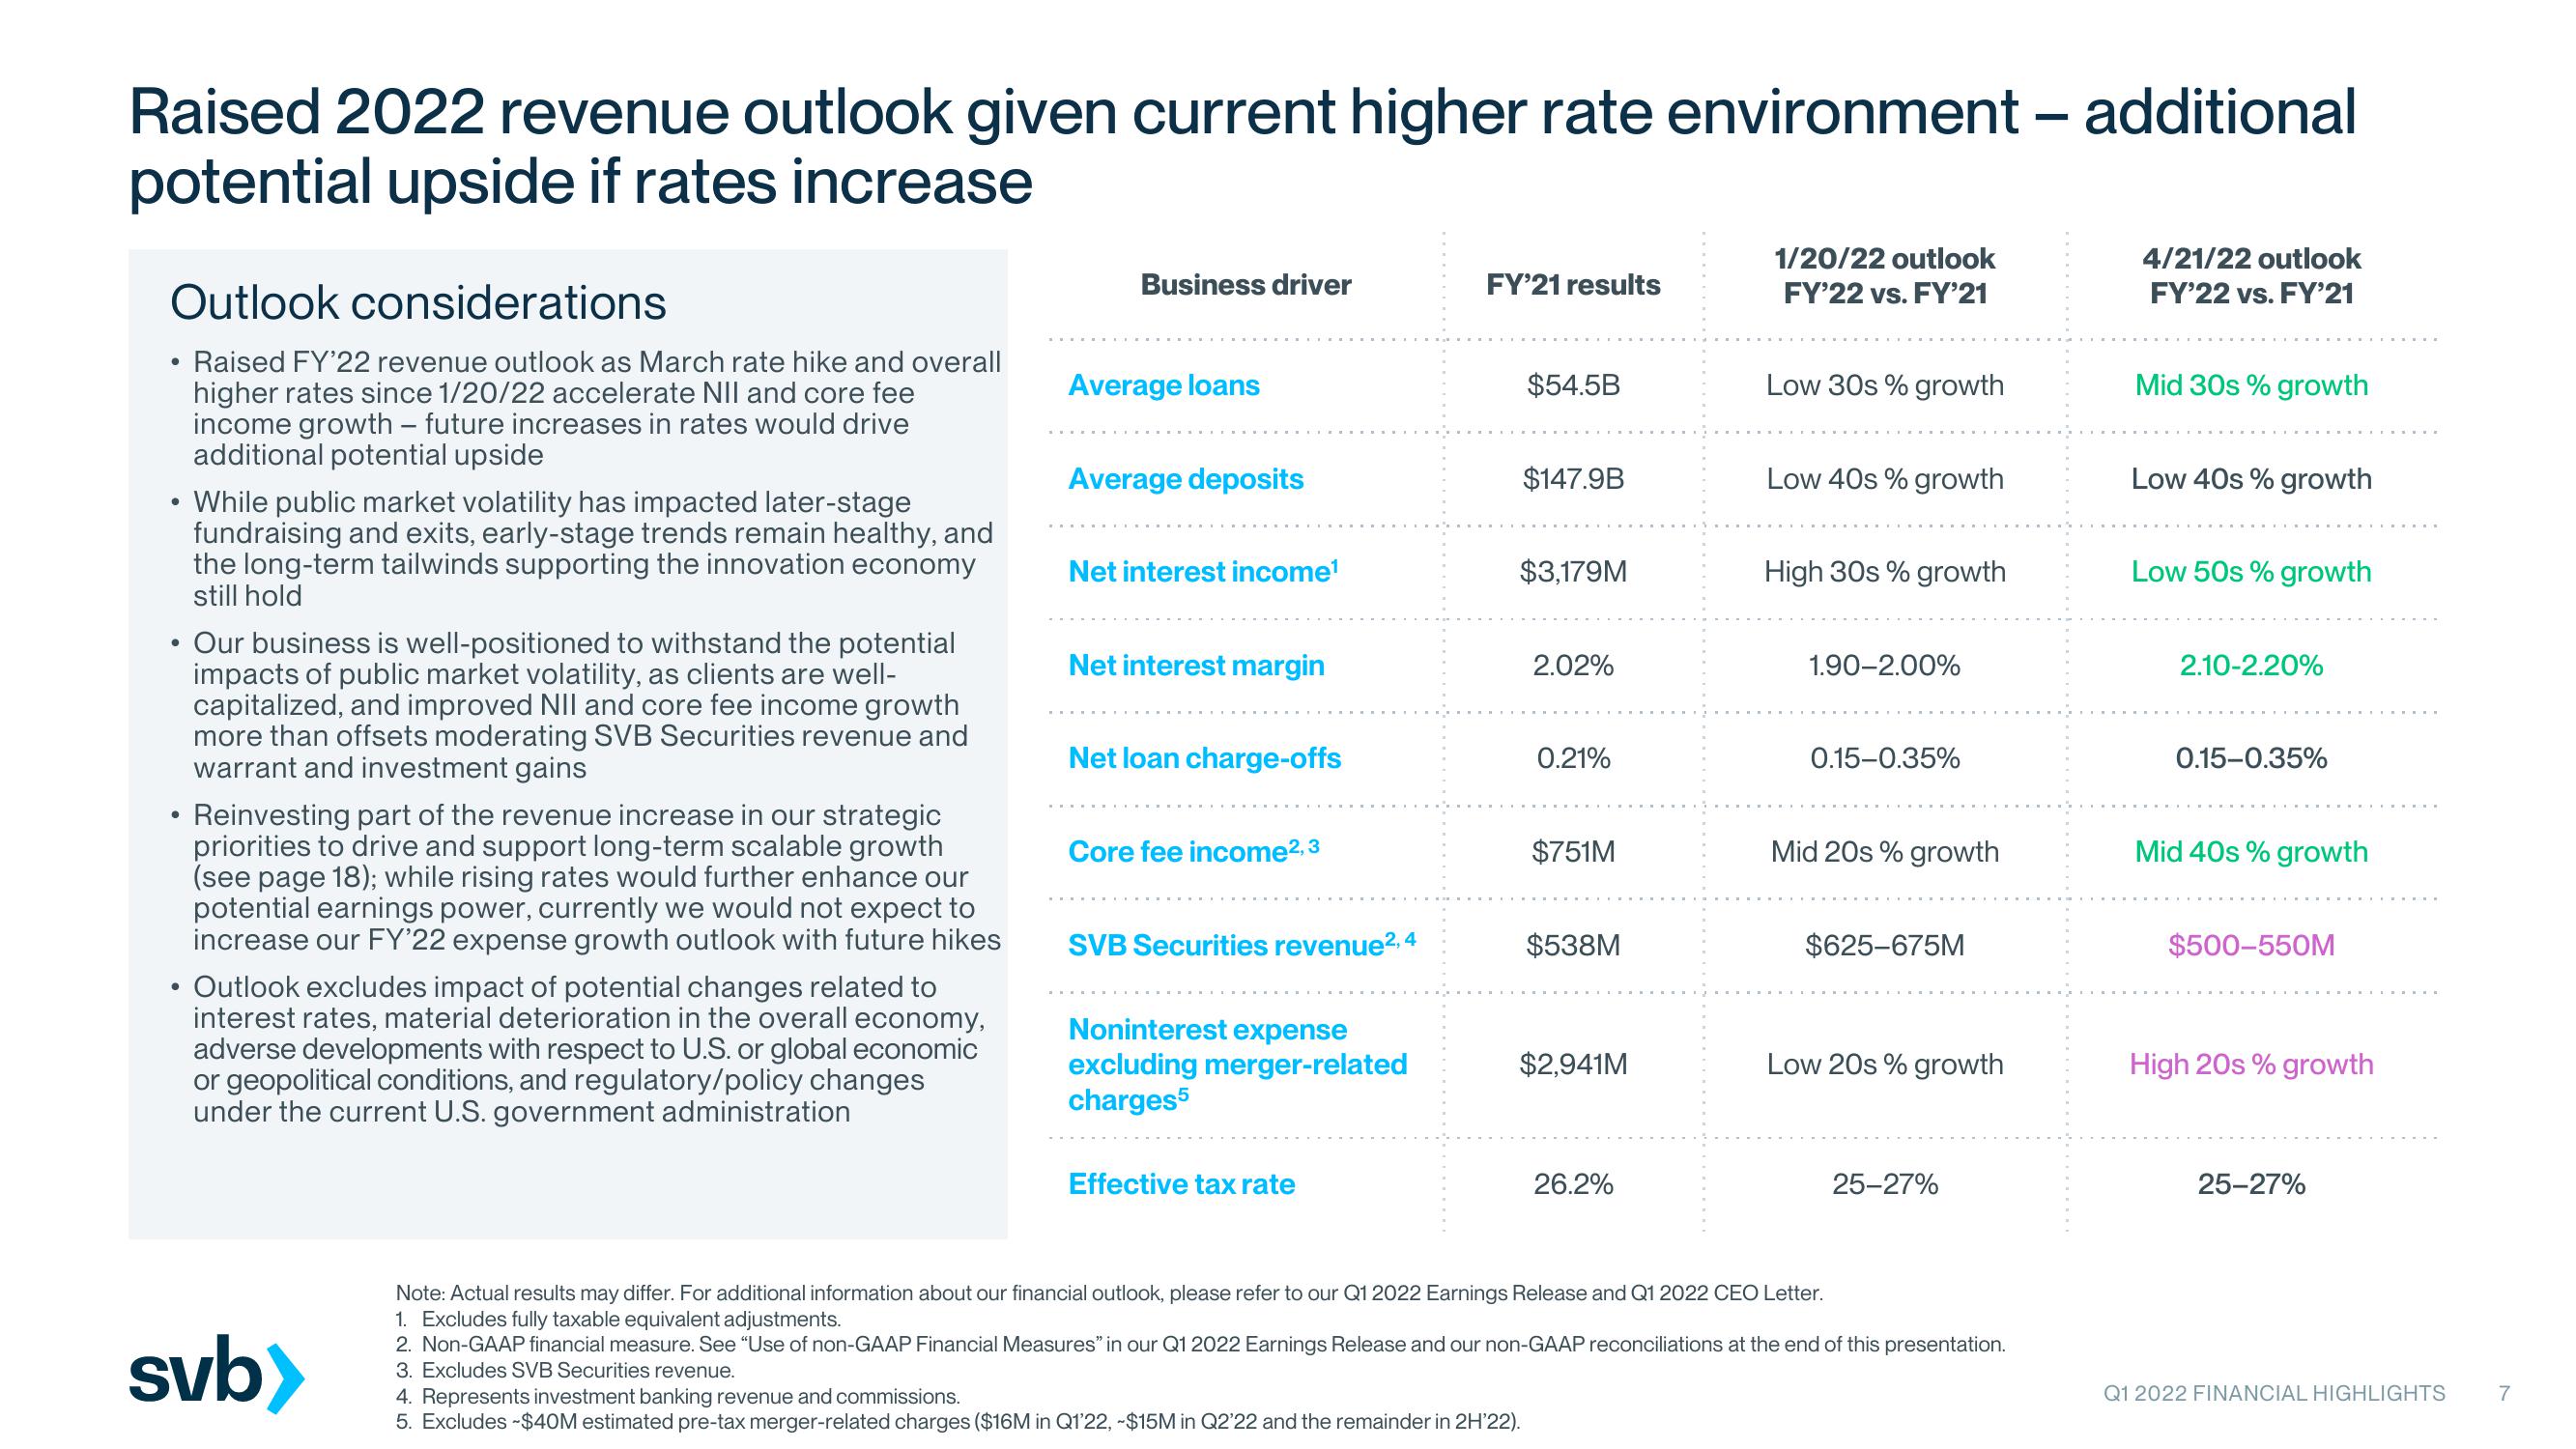
Raised FY'22 revenue outlook as March rate hike and overall
higher rates since 1/20/22 accelerate NII and core fee
income growth - future increases in rates would drive
additional potential upside
●
•
●
●
While public market volatility has impacted later-stage
fundraising and exits, early-stage trends remain healthy, and
the long-term tailwinds supporting the innovation economy
still hold
Our business is well-positioned to withstand the potential
impacts of public market volatility, as clients are well-
capitalized, and improved NII and core fee income growth
more than offsets moderating SVB Securities revenue and
warrant and investment gains
Reinvesting part of the revenue increase in our strategic
priorities to drive and support long-term scalable growth
(see page 18); while rising rates would further enhance our
potential earnings power, currently we would not expect to
increase our FY'22 expense growth outlook with future hikes
●
• Outlook excludes impact of potential changes related to
interest rates, material deterioration in the overall economy,
adverse developments with respect to U.S. or global economic
or geopolitical conditions, and regulatory/policy changes
under the current U.S. government administration
svb>
Business driver
Average loans
Average deposits
Net interest income¹
Net interest margin
Net loan charge-offs
Core fee income2,3
SVB Securities revenue², 4
Noninterest expense
excluding merger-related
charges5
Effective tax rate
FY'21 results
$54.5B
$147.9B
$3,179M
4. Represents investment banking revenue and commissions.
5. Excludes $40M estimated pre-tax merger-related charges ($16M in Q1'22, -$15M in Q2'22 and the remainder in 2H'22).
2.02%
0.21%
$751M
$538M
$2,941M
26.2%
1/20/22 outlook
FY'22 vs. FY'21
Low 30s % growth
Low 40s % growth
High 30s % growth
1.90-2.00%
0.15-0.35%
Mid 20s % growth
$625-675M
Low 20s % growth
25-27%
Note: Actual results may differ. For additional information about our financial outlook, please refer to our Q1 2022 Earnings Release and Q1 2022 CEO Letter.
1. Excludes fully taxable equivalent adjustments.
2. Non-GAAP financial measure. See “Use of non-GAAP Financial Measures" in our Q1 2022 Earnings Release and our non-GAAP reconciliations at the end of this presentation.
3. Excludes SVB Securities revenue.
4/21/22 outlook
FY'22 vs. FY'21
Mid 30s % growth
Low 40s % growth
Low 50s % growth
2.10-2.20%
0.15-0.35%
Mid 40s % growth
$500-550M
High 20s % growth
25-27%
Q1 2022 FINANCIAL HIGHLIGHTS
7View entire presentation