Apollo Global Management Investor Presentation Deck
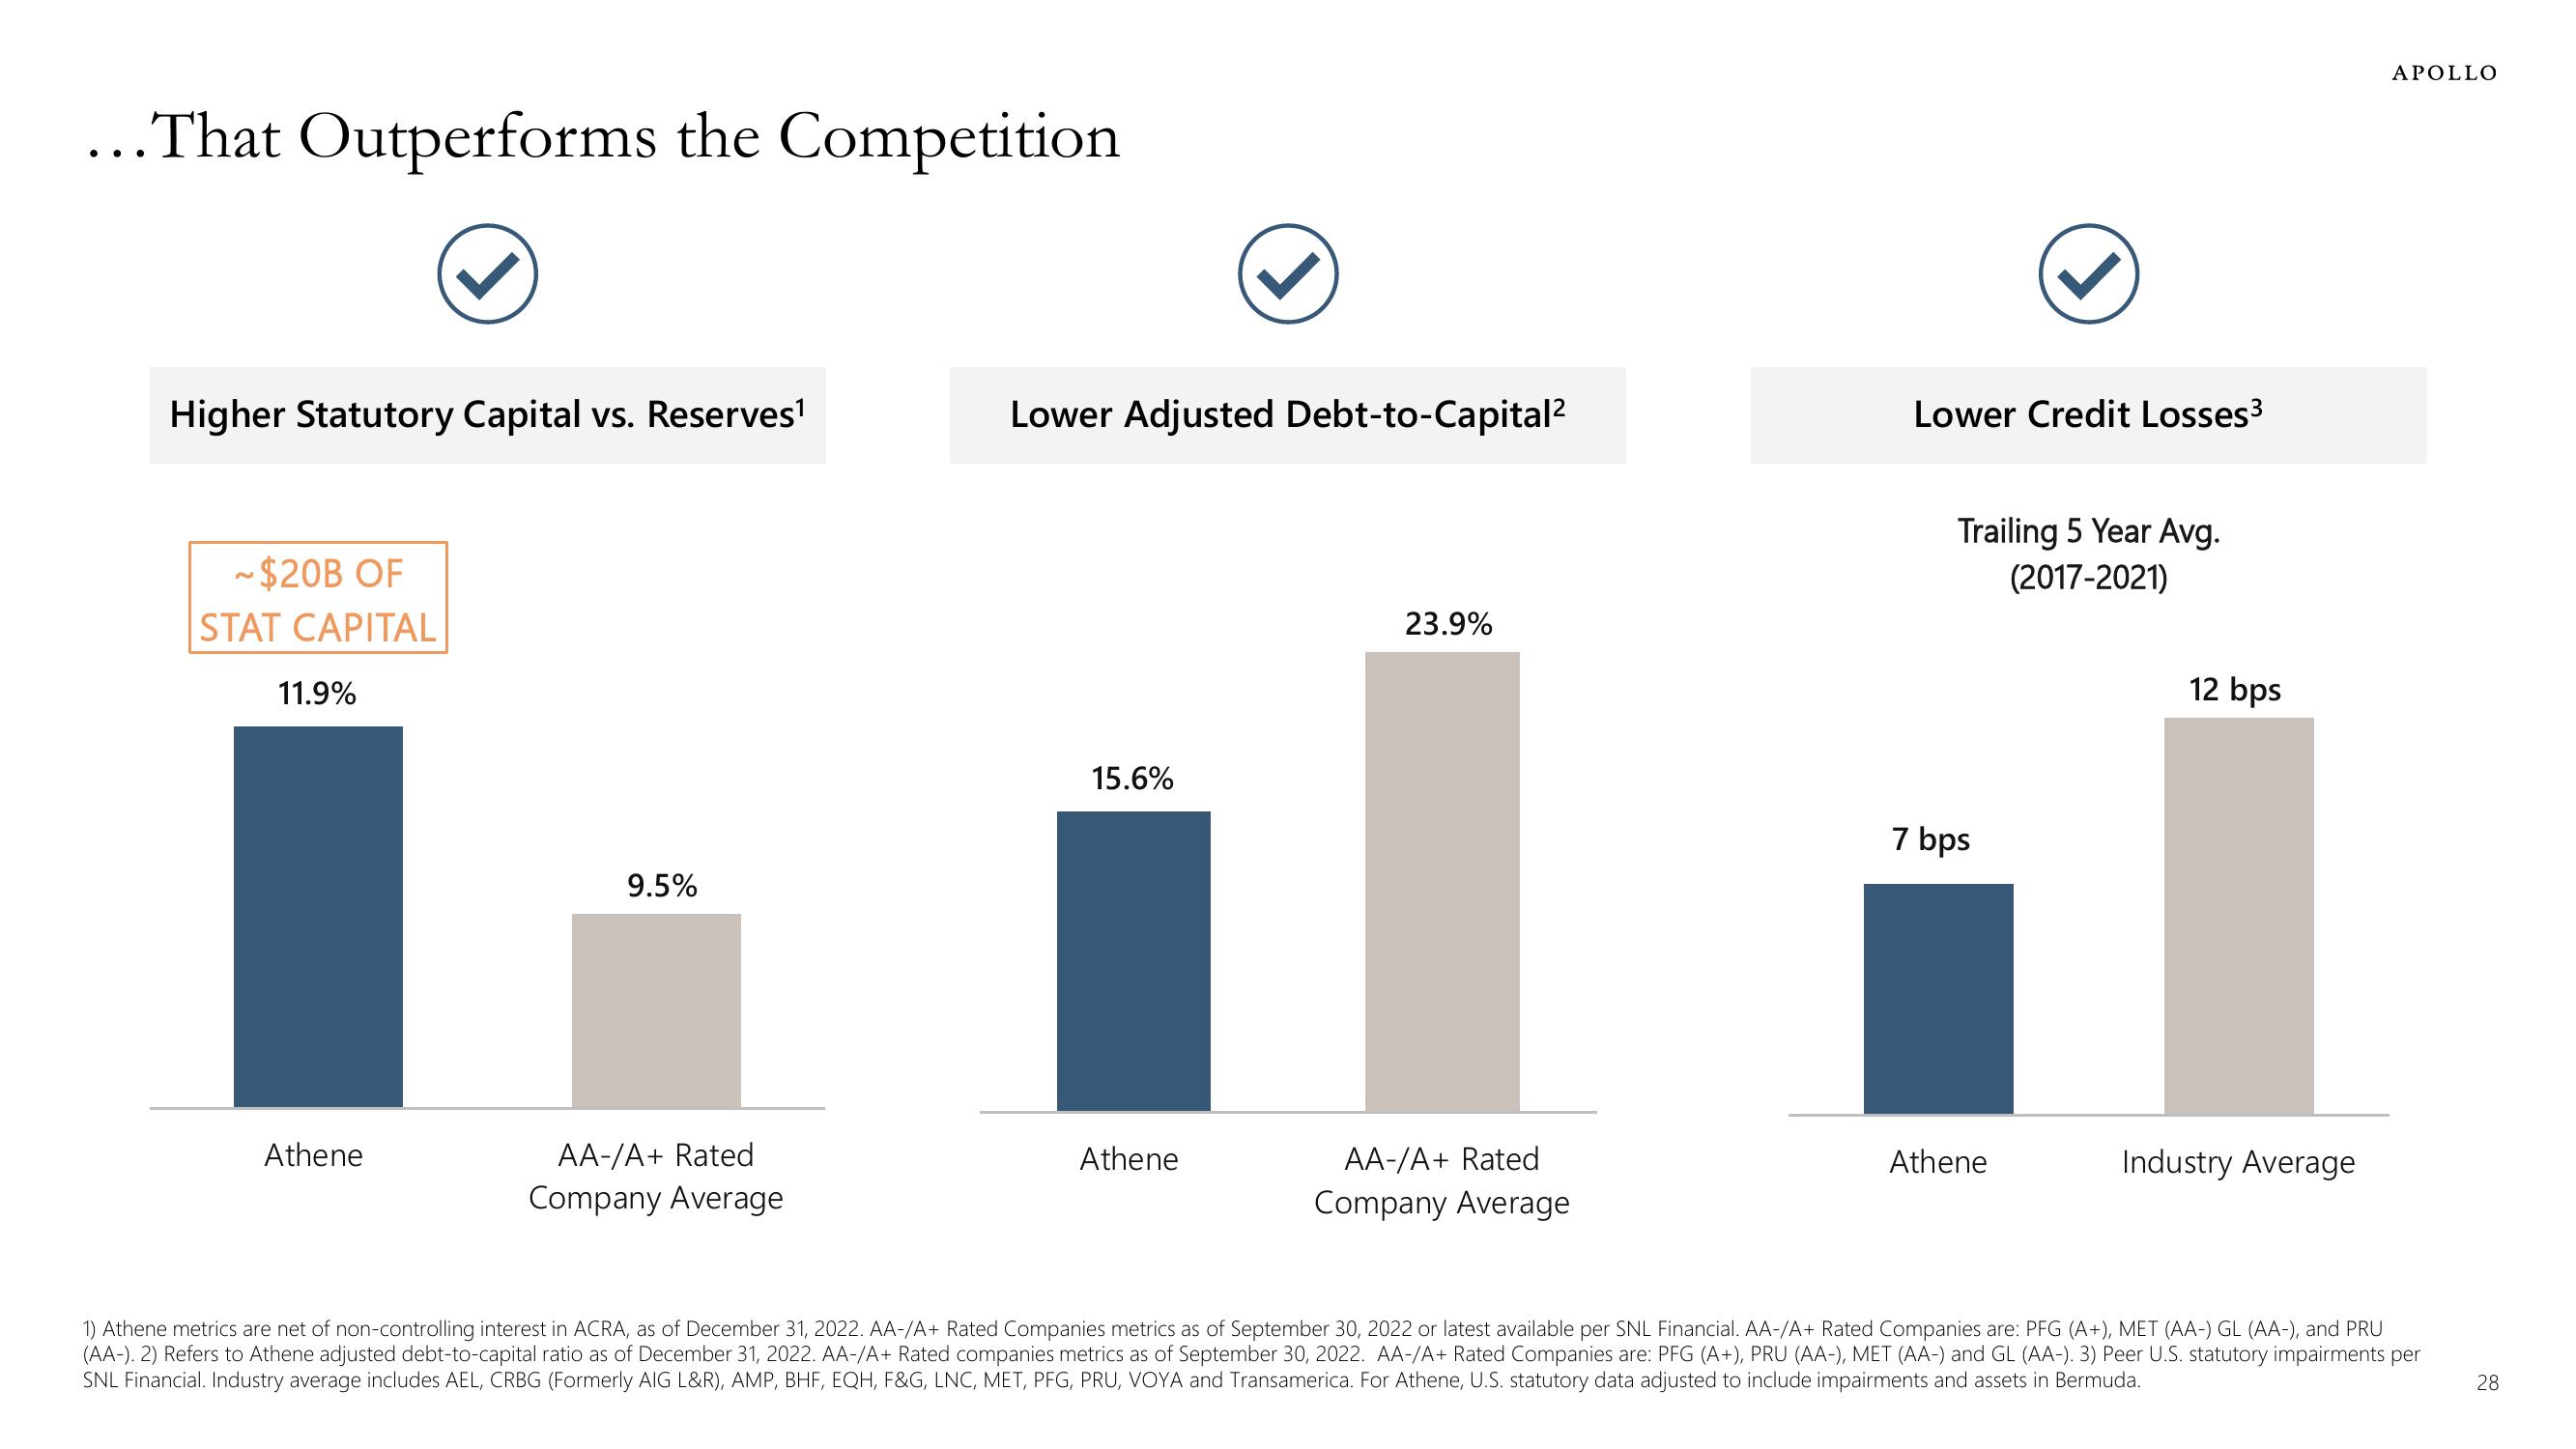
...That Outperforms the Competition
Higher Statutory Capital vs. Reserves¹
~$20B OF
STAT CAPITAL
11.9%
Athene
9.5%
AA-/A+ Rated
Company Average
Lower Adjusted Debt-to-Capital²
15.6%
Athene
23.9%
AA-/A+ Rated
Company Average
Lower Credit Losses³
Trailing 5 Year Avg.
(2017-2021)
7 bps
Athene
12 bps
Industry Average
APOLLO
1) Athene metrics are net of non-controlling interest in ACRA, as of December 31, 2022. AA-/A+ Rated Companies metrics as of September 30, 2022 or latest available per SNL Financial. AA-/A+ Rated Companies are: PFG (A+), MET (AA-) GL (AA-), and PRU
(AA-). 2) Refers to Athene adjusted debt-to-capital ratio as of December 31, 2022. AA-/A+ Rated companies metrics as of September 30, 2022. AA-/A+ Rated Companies are: PFG (A+), PRU (AA-), MET (AA-) and GL (AA-). 3) Peer U.S. statutory impairments per
SNL Financial. Industry average includes AEL, CRBG (Formerly AIG L&R), AMP, BHF, EQH, F&G, LNC, MET, PFG, PRU, VOYA and Transamerica. For Athene, U.S. statutory data adjusted to include impairments and assets in Bermuda.
28View entire presentation