Bill.com Investor Presentation Deck
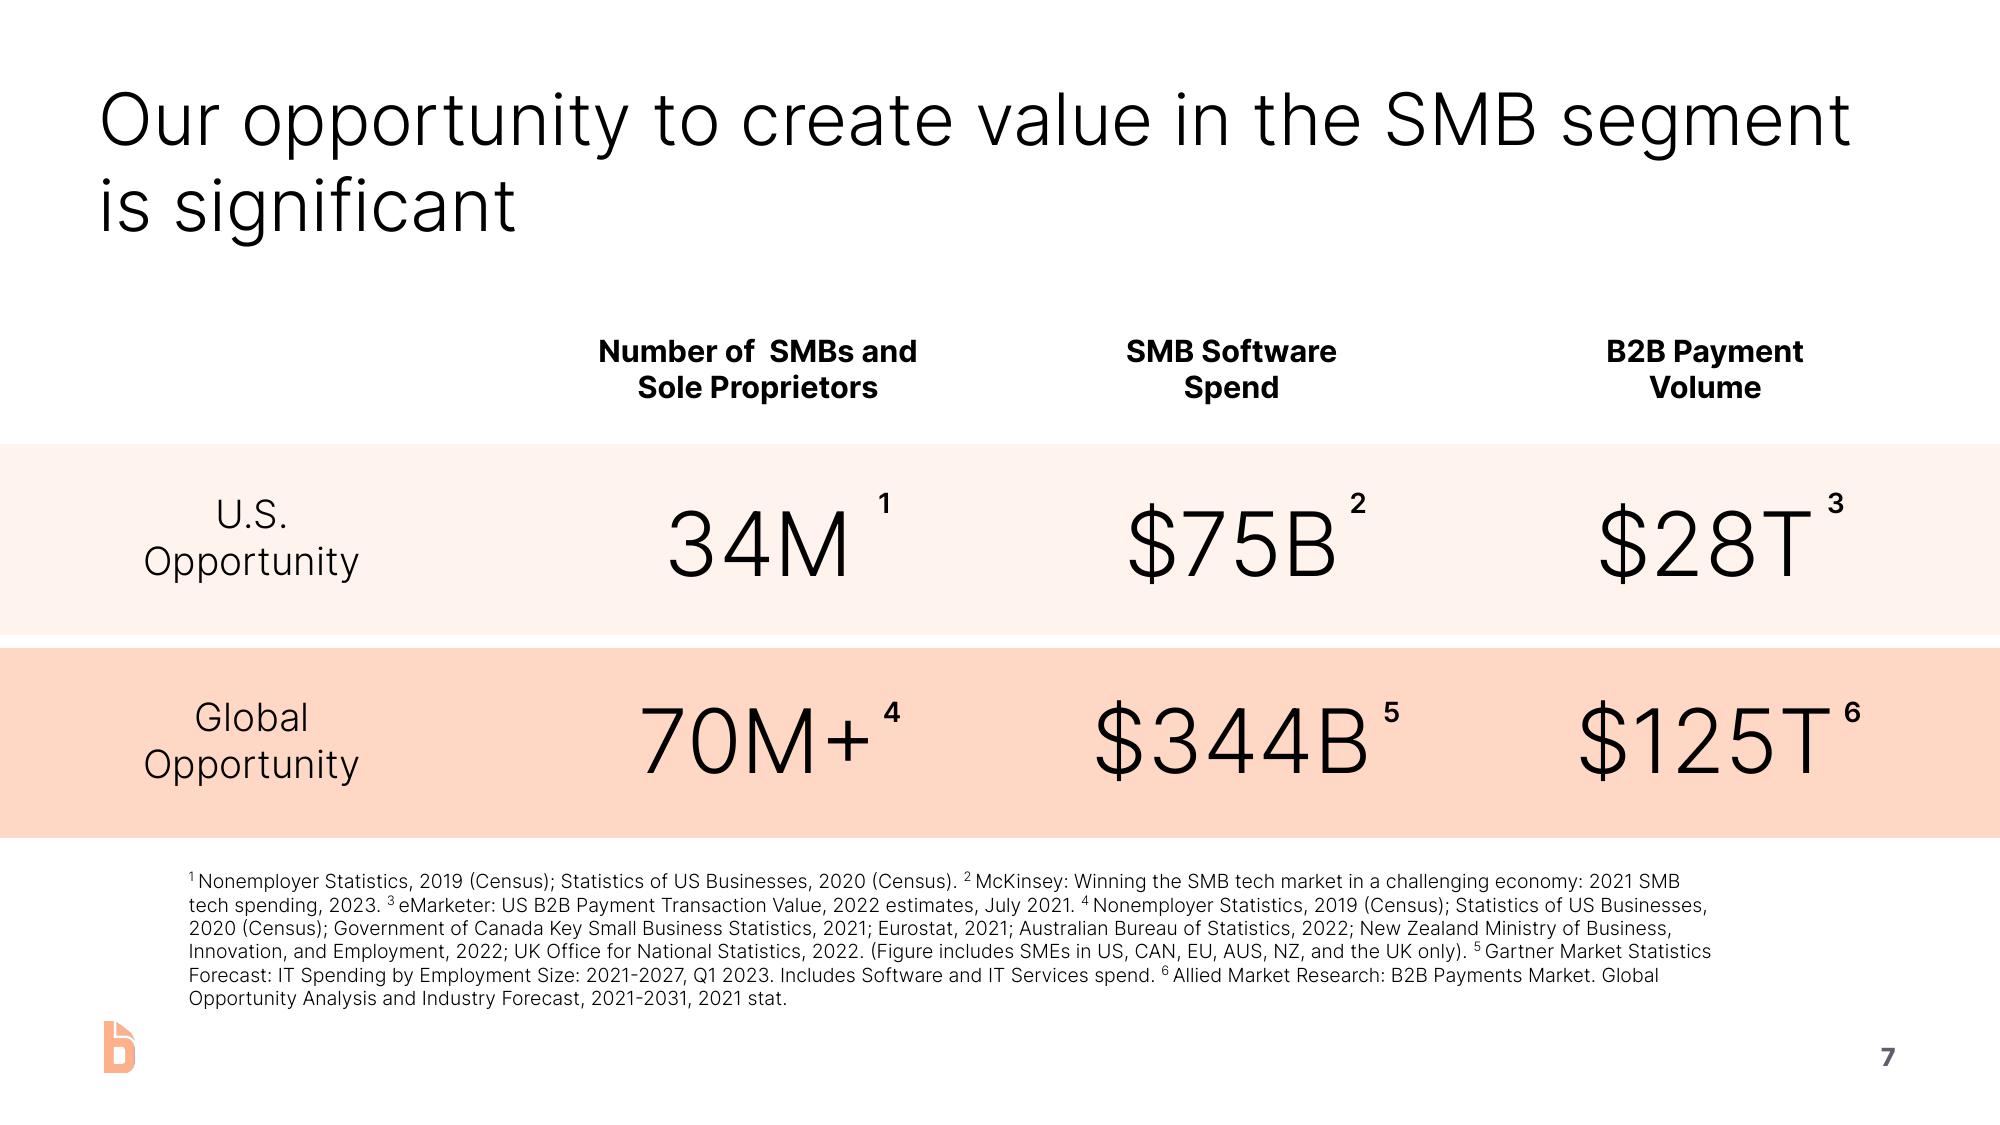
Our opportunity to create value in the SMB segment
is significant
U.S.
Opportunity
Global
Opportunity
Number of SMBs and
Sole Proprietors
34M¹
SMB Software
Spend
2
$75B²
B2B Payment
Volume
$28T³
70M+*
$344B5
$125T
¹ Nonemployer Statistics, 2019 (Census); Statistics of US Businesses, 2020 (Census). 2 McKinsey: Winning the SMB tech market in a challenging economy: 2021 SMB
tech spending, 2023. 3 eMarketer: US B2B Payment Transaction Value, 2022 estimates, July 2021. 4 Nonemployer Statistics, 2019 (Census); Statistics of US Businesses,
2020 (Census); Government of Canada Key Small Business Statistics, 2021; Eurostat, 2021; Australian Bureau of Statistics, 2022; New Zealand Ministry of Business,
Innovation, and Employment, 2022; UK Office for National Statistics, 2022. (Figure includes SMEs in US, CAN, EU, AUS, NZ, and the UK only). 5 Gartner Market Statistics
Forecast: IT Spending by Employment Size: 2021-2027, Q1 2023. Includes Software and IT Services spend. 6 Allied Market Research: B2B Payments Market. Global
Opportunity Analysis and Industry Forecast, 2021-2031, 2021 stat.
b
6
7View entire presentation