Silicon Valley Bank Results Presentation Deck
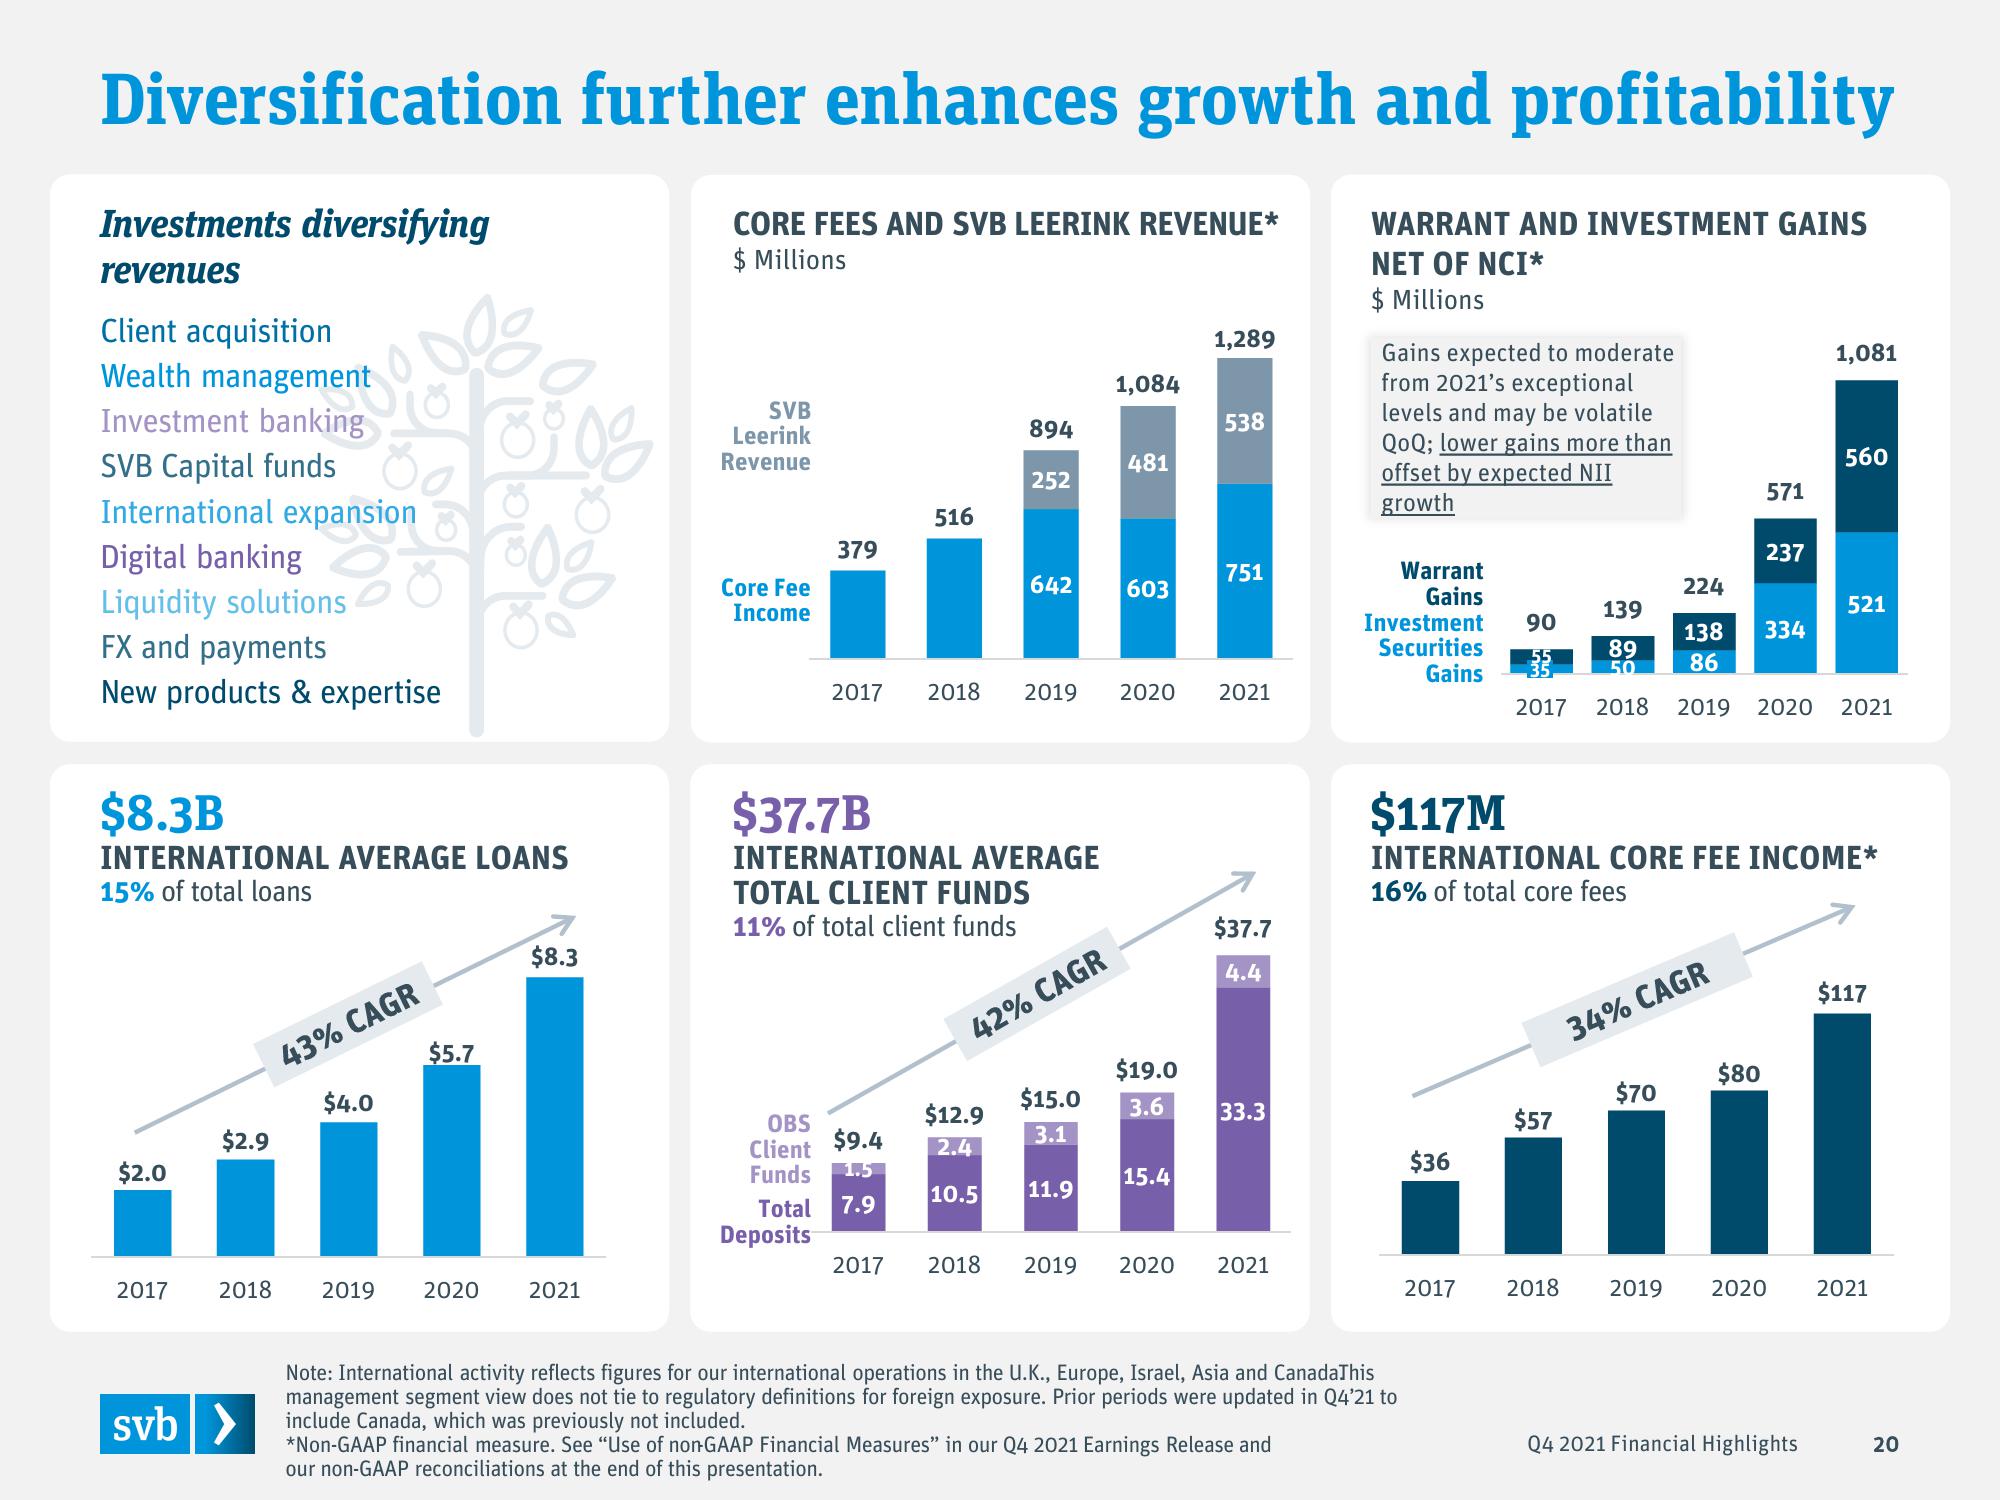
Diversification further enhances growth and profitability
CORE FEES AND SVB LEERINK REVENUE*
$ Millions
WARRANT AND INVESTMENT GAINS
NET OF NCI*
$ Millions
Investments diversifying
revenues
Client acquisition
Wealth management
Investment banking
SVB Capital funds
International expansion
Digital banking
Liquidity solutions
FX and payments
New products & expertise
$8.3B
INTERNATIONAL AVERAGE LOANS
15% of total loans
$2.0
$2.9
2017 2018
svb >
43% CAGR
$4.0
$5.7
8900
2019 2020
$8.3
2021
SVB
Leerink
Revenue
Core Fee
Income
379
2017
OBS
Client
Funds 1.5
$9.4
Deposits
Total 7.9
516
894
$37.7B
INTERNATIONAL AVERAGE
TOTAL CLIENT FUNDS
11% of total client funds
252
$12.9
2.4
642 603
1,084
42% CAGR
$15.0
3.1
481
2018 2019 2020 2021
10.5 11.9
$19.0
3.6
1,289
15.4
538
751
$37.7
4.4
33.3
2017 2018 2019 2020 2021
Gains expected to moderate
from 2021's exceptional
levels and may be volatile
QoQ; lower gains more than
offset by expected NII
growth
Warrant
Gains
Investment 90
Securities
Gains
Note: International activity reflects figures for our international operations in the U.K., Europe, Israel, Asia and CanadaThis
management segment view does not tie to regulatory definitions for foreign exposure. Prior periods were updated in Q4'21 to
include Canada, which was previously not included.
*Non-GAAP financial measure. See "Use of non-GAAP Financial Measures" in our Q4 2021 Earnings Release and
our non-GAAP reconciliations at the end of this presentation.
$36
2017
$57
2018
$117M
INTERNATIONAL CORE FEE INCOME*
16% of total core fees
571
224
138 334
34% CAGR
$70
237
139
89
50 86
2017 2018 2019 2020 2021
$80
1,081
560
521
Q4 2021 Financial Highlights
$117
2019 2020 2021
20View entire presentation