Silicon Valley Bank Results Presentation Deck
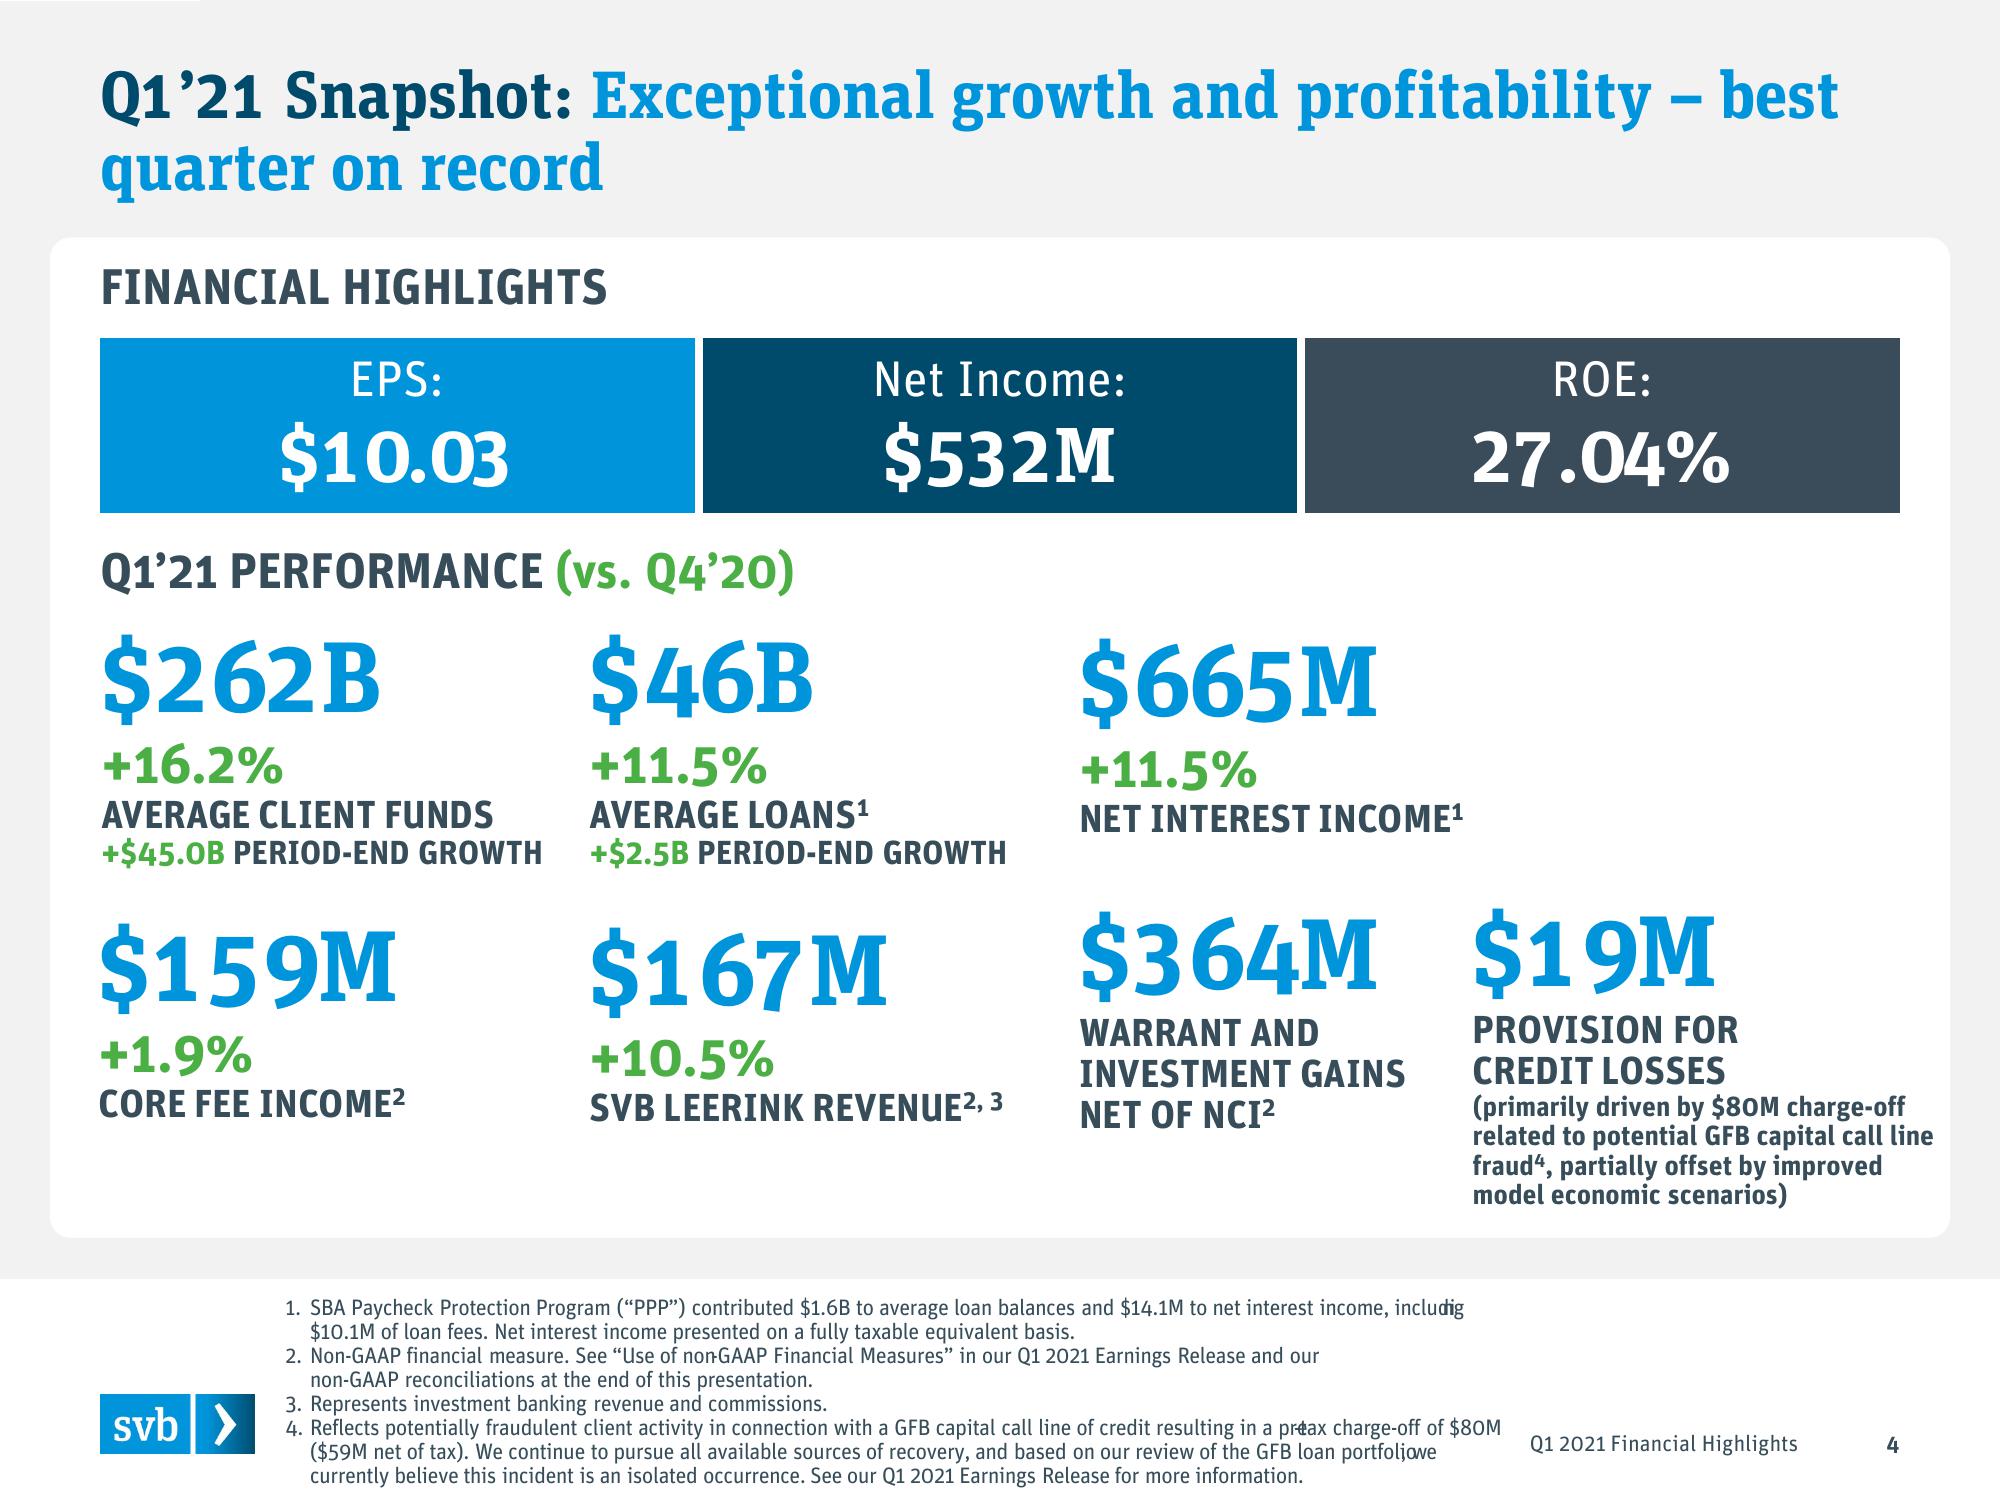
Q1'21 Snapshot: Exceptional growth and profitability - best
quarter on record
FINANCIAL HIGHLIGHTS
EPS:
$10.03
Q1'21 PERFORMANCE (vs. Q4'20)
$46B
+11.5%
AVERAGE LOANS¹
+$2.5B PERIOD-END GROWTH
$262B
+16.2%
AVERAGE CLIENT FUNDS
+$45.OB PERIOD-END GROWTH
$159M
+1.9%
CORE FEE INCOME²
svb >
Net Income:
$532M
$167 M
+10.5%
SVB LEERINK REVENUE², 3
$665 M
+11.5%
NET INTEREST INCOME¹
ROE:
27.04%
$364M $19M
PROVISION FOR
CREDIT LOSSES
(primarily driven by $80M charge-off
related to potential GFB capital call line
fraud", partially offset by improved
model economic scenarios)
WARRANT AND
INVESTMENT GAINS
NET OF NCI²
1. SBA Paycheck Protection Program ("PPP") contributed $1.6B to average loan balances and $14.1M to net interest income, includig
$10.1M of loan fees. Net interest income presented on a fully taxable equivalent basis.
2. Non-GAAP financial measure. See "Use of non-GAAP Financial Measures" in our Q1 2021 Earnings Release and our
non-GAAP reconciliations at the end of this presentation.
3. Represents investment banking revenue and commissions.
4. Reflects potentially fraudulent client activity in connection with a GFB capital call line of credit resulting in a preax charge-off of $80M
($59M net of tax). We continue to pursue all available sources of recovery, and based on our review of the GFB loan portfoliowe
currently believe this incident is an isolated occurrence. See our Q1 2021 Earnings Release for more information.
Q1 2021 Financial Highlights
4View entire presentation