Silicon Valley Bank Results Presentation Deck
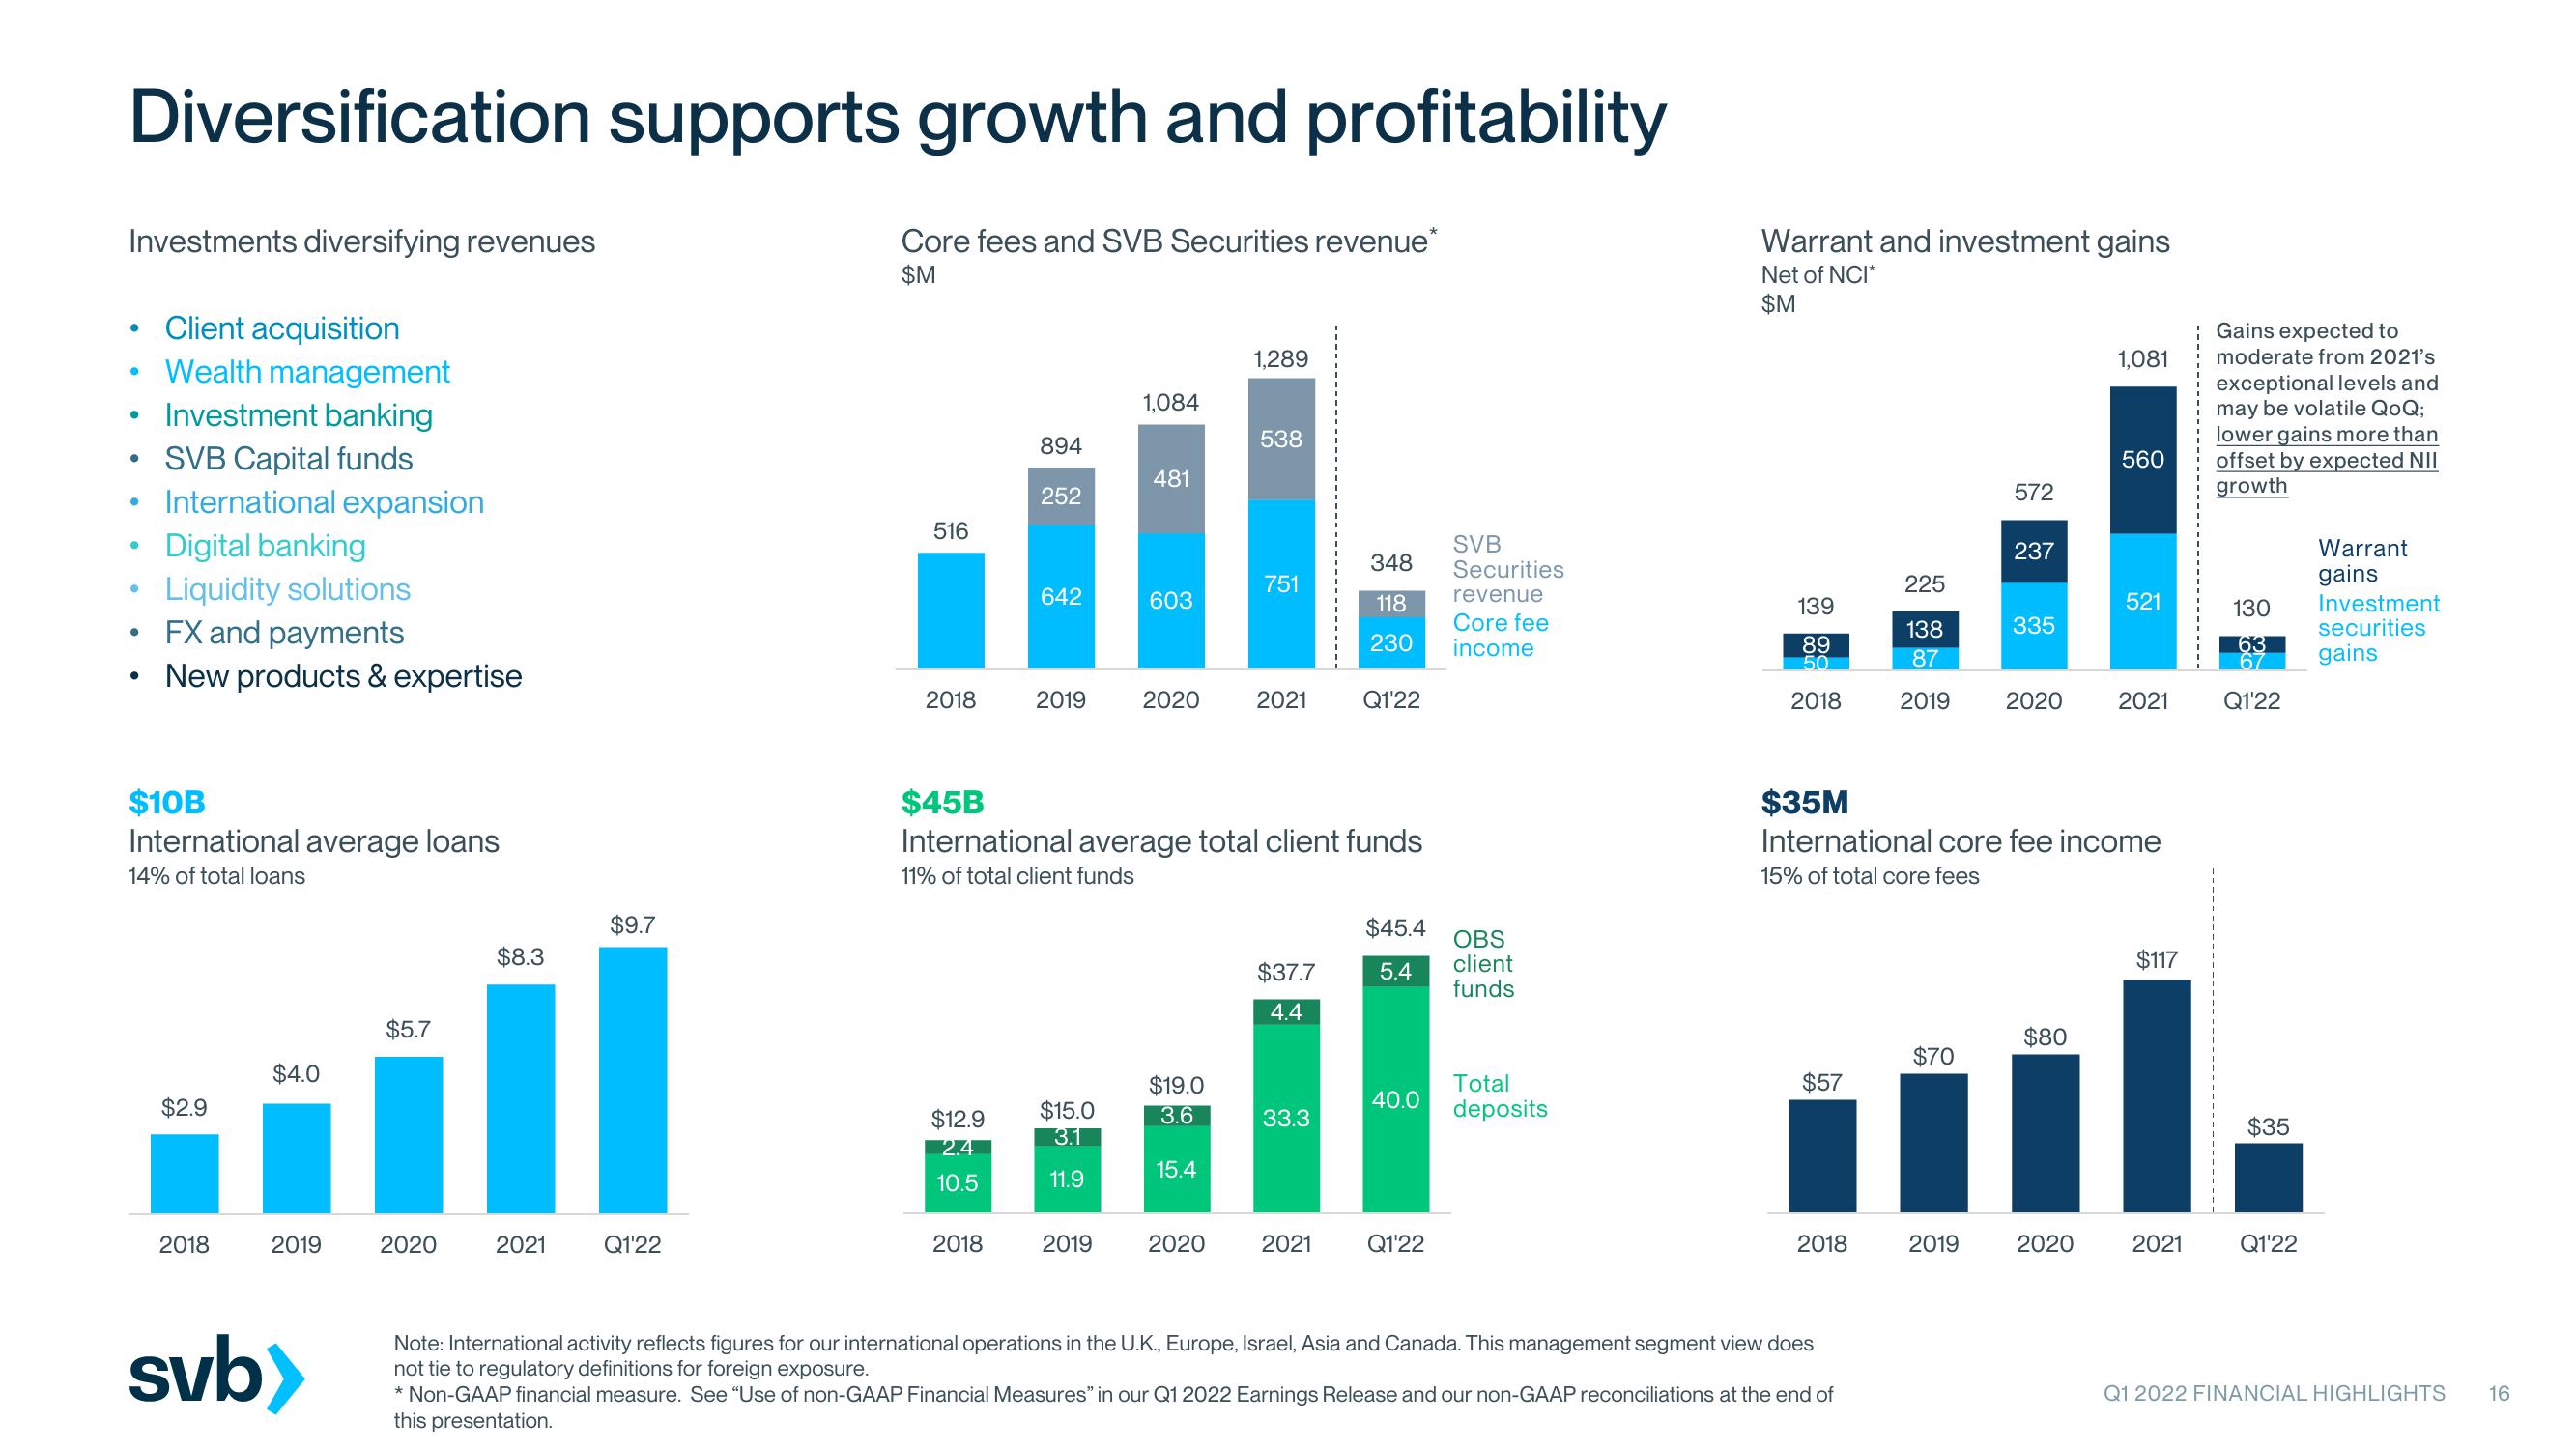
Diversification supports growth and profitability
Investments diversifying revenues
●
●
●
●
e
●
Client acquisition
Wealth management
Investment banking
SVB Capital funds
International expansion
Digital banking
Liquidity solutions
FX and payments
New products & expertise
$10B
International average loans
14% of total loans
$2.9
2018
$4.0
2019
svb>
$5.7
2020
$8.3
2021
$9.7
Q1'22
Core fees and SVB Securities revenue*
$M
516
2018
$12.9
2.4
10.5
894
2018
252
642
2019
$15.0
3.1
11.9
1,084
2019
481
603
2020
$19.0
3.6
$45B
International average total client funds
11% of total client funds
15.4
1,289
2020
538
751
2021
$37.7
4.4
33.3
348
118
230
2021
Q1'22
$45.4
OBS
5.4 client
funds
40.0
SVB
Securities
revenue
Core fee
income
Q1'22
Total
deposits
Warrant and investment gains
Net of NCI*
$M
139
89
50
2018
$57
2018
225
138
87
2019
Note: International activity reflects figures for our international operations in the U.K., Europe, Israel, Asia and Canada. This management segment view does
not tie to regulatory definitions for foreign exposure.
* Non-GAAP financial measure. See "Use of non-GAAP Financial Measures" in our Q1 2022 Earnings Release and our non-GAAP reconciliations at the end of
this presentation.
$70
572
2019
237
335
2020
$35M
International core fee income
15% of total core fees
$80
1,081
2020
560
521
2021
$117
2021
Gains expected to
moderate from 2021's
exceptional levels and
may be volatile QoQ;
lower gains more than
offset by expected NII
growth
130
63
67
Q1'22
$35
Q1'22
Warrant
gains
Investment
securities
gains
Q1 2022 FINANCIAL HIGHLIGHTS 16View entire presentation