Apollo Global Management Investor Presentation Deck
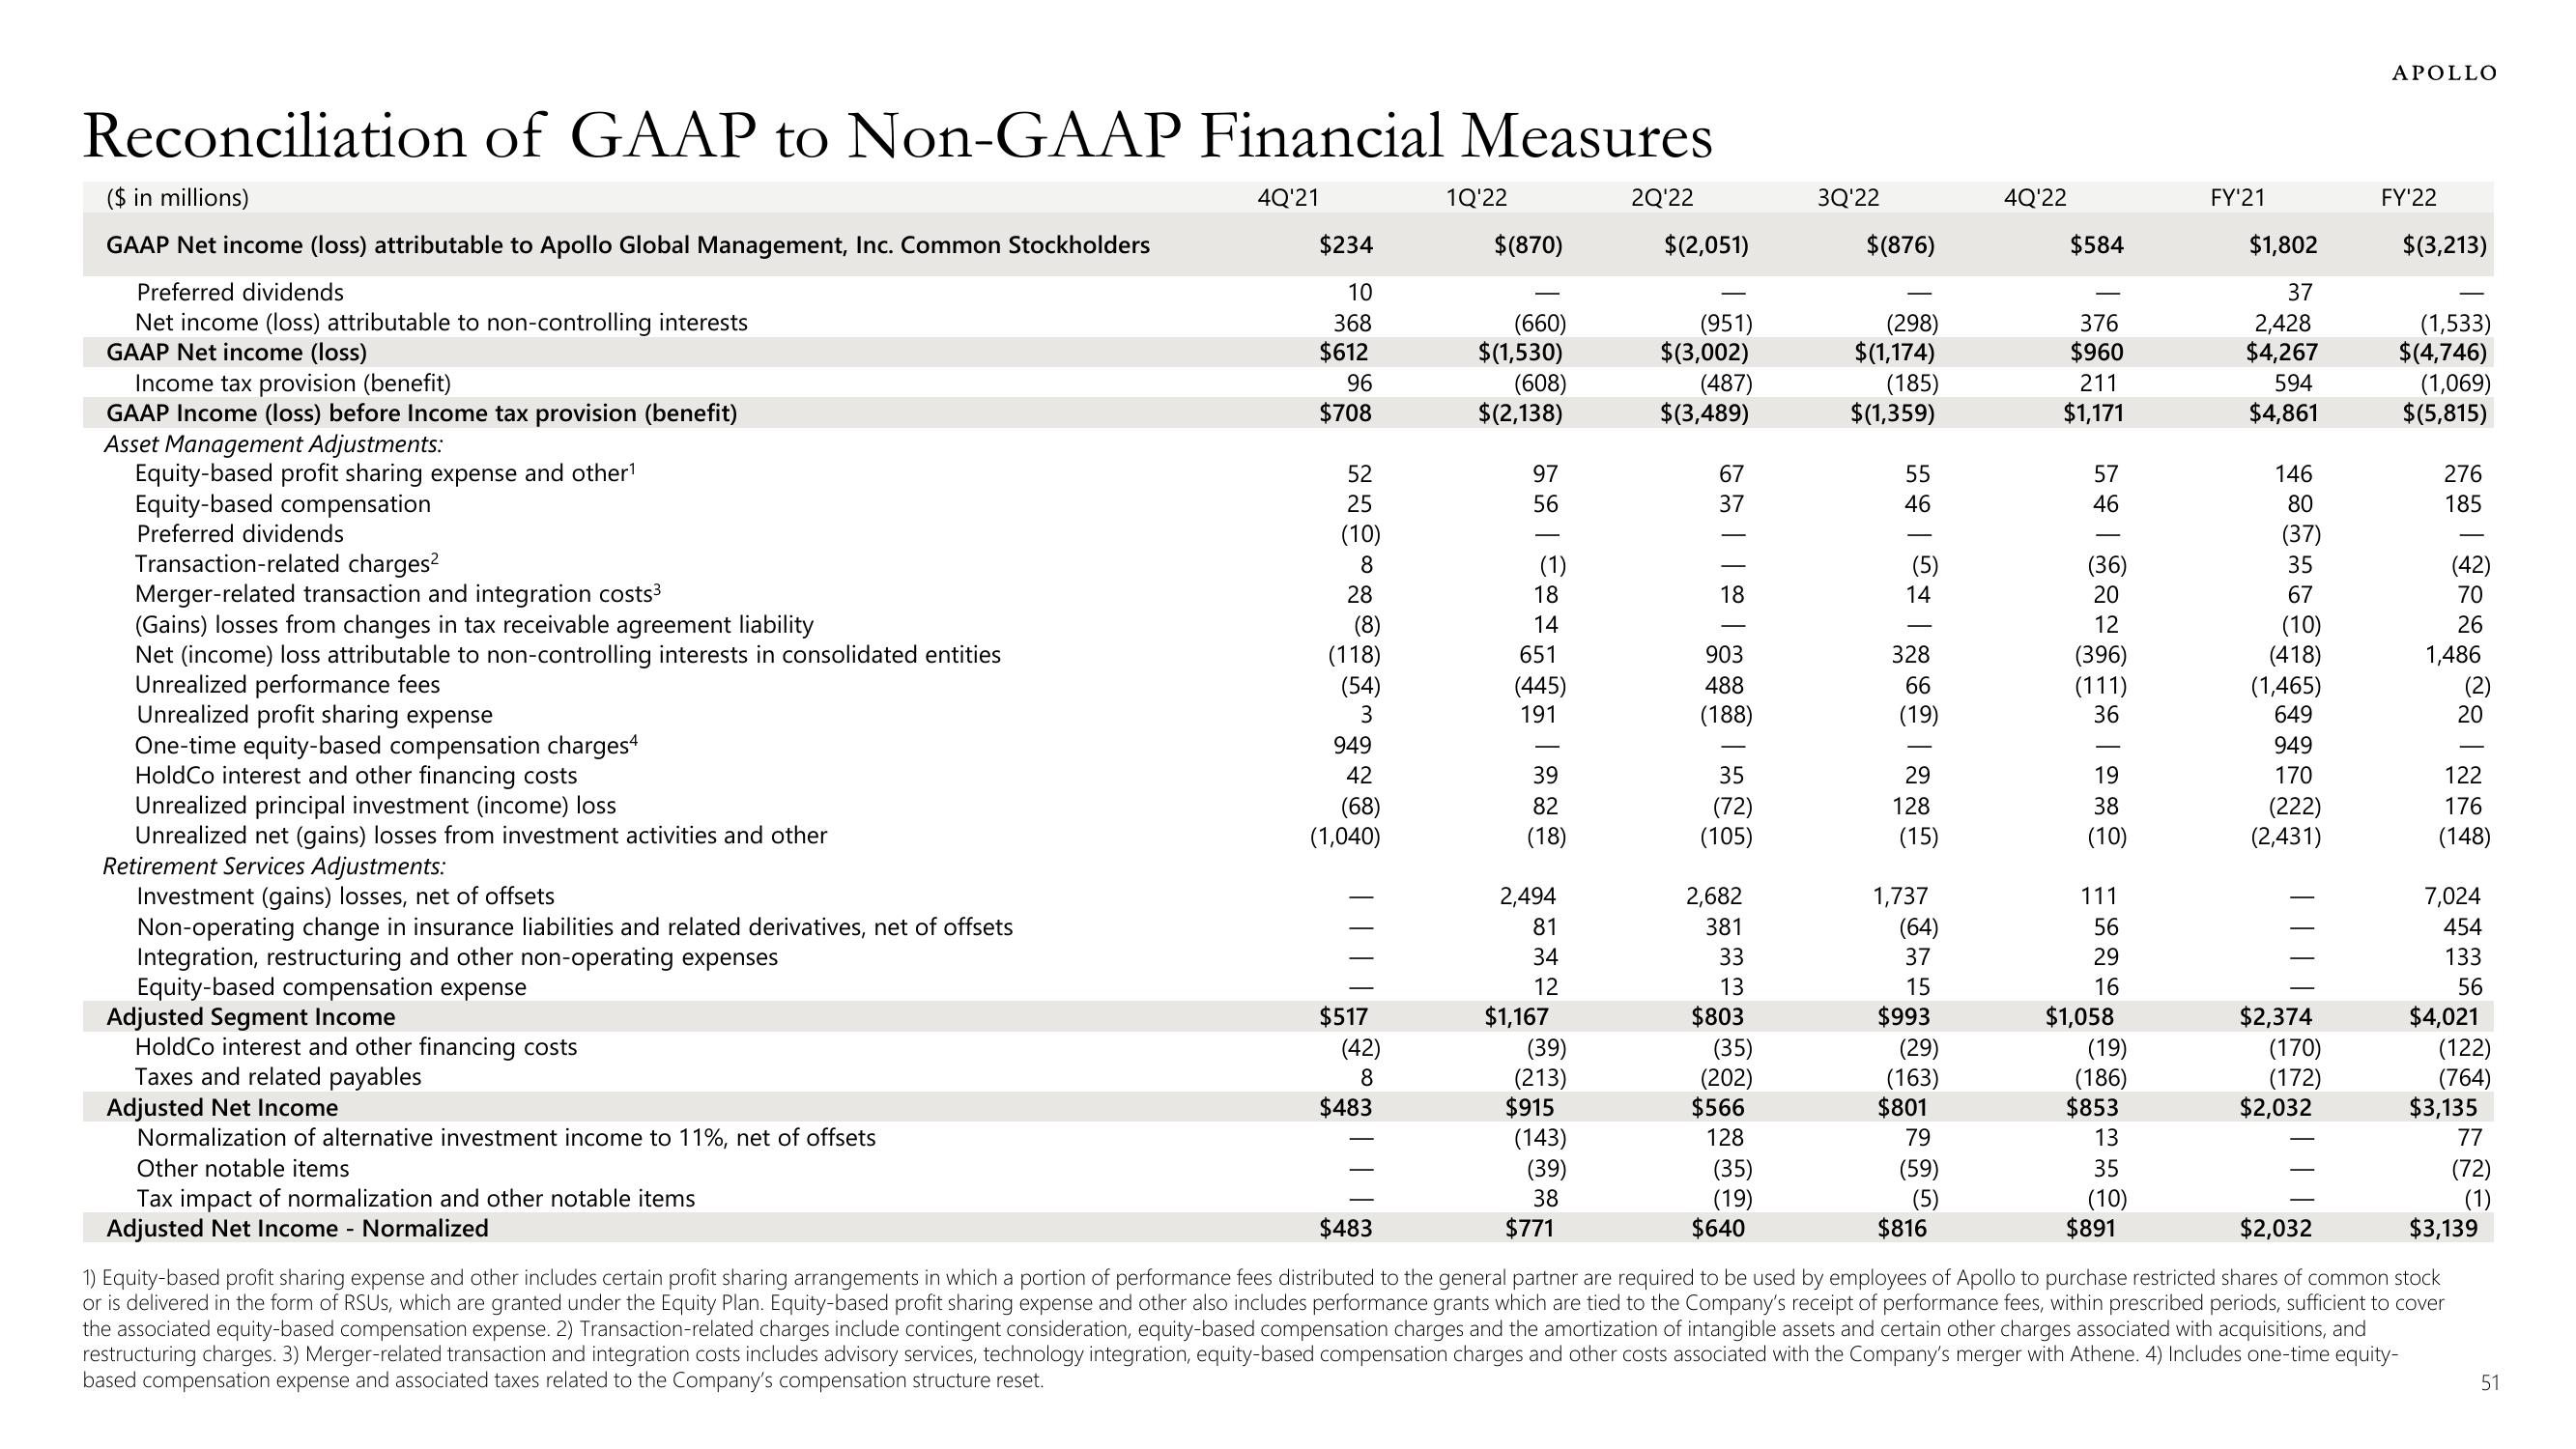
Reconciliation of GAAP to Non-GAAP Financial Measures
($ in millions)
GAAP Net income (loss) attributable to Apollo Global Management, Inc. Common Stockholders
Preferred dividends
Net income (loss) attributable to non-controlling interests
GAAP Net income (loss)
Income tax provision (benefit)
GAAP Income (loss) before Income tax provision (benefit)
Asset anagement Adjustments:
Equity-based profit sharing expense and other¹
Equity-based compensation
Preferred dividends
Transaction-related charges²
Merger-related transaction and integration costs³
(Gains) losses from changes in tax receivable agreement liability
Net (income) loss attributable to non-controlling interests in consolidated entities
Unrealized performance fees
Unrealized profit sharing expense
One-time equity-based compensation charges4
HoldCo interest and other financing costs
Unrealized principal investment (income) loss
Unrealized net (gains) losses from investment activities and other
Retirement Services Adjustments:
Investment (gains) losses, net of offsets
Non-operating change in insurance liabilities and related derivatives, net of offsets
Integration, restructuring and other non-operating expenses
Equity-based compensation expense
Adjusted Segment Income
HoldCo interest and other financing costs
Taxes and related payables
Adjusted Net Income
Normalization of alternative investment income to 11%, net of offsets
Other notable items
Tax impact of normalization and other notable items
Adjusted Net Income - Normalized
4Q'21
$234
10
368
$612
96
$708
52
25
(10)
8
28
(8)
(118)
(54)
3
949
42
(68)
(1,040)
$517
(42)
8
$483
1Q'22
$(870)
(660)
$(1,530)
(608)
$(2,138)
97
56
(1)
18
14
651
(445)
191
39
82
(18)
2,494
81
34
12
$1,167
(39)
(213)
$915
(143)
(39)
38
$771
2Q'22
$(2,051)
(951)
$ (3,002)
(487)
$(3,489)
\ \ ៩ \ \ ||
T
903
488
(188)
(72)
(105)
2,682
381
33
13
$803
(35)
(202)
$566
128
(35)
(19)
3Q'22
$640
$(876)
(298)
$(1,174)
(185)
$(1,359)
55
46
(5)
14
328
66
(19)
29
128
(15)
1,737
(64)
37
15
$993
(29)
(163)
$801
79
(59)
(5)
4Q'22
$816
$584
376
$960
211
$1,171
57
46
(36)
20
12
(396)
(111)
36
19
38
(10)
111
56
29
16
$1,058
(19)
(186)
$853
13
35
(10)
FY'21
$891
$1,802
37
2,428
$4,267
594
$4,861
146
80
(37)
35
67
(10)
(418)
(1,465)
649
949
170
(222)
(2,431)
||||||
$2,374
(170)
(172)
$2,032
APOLLO
FY'22
$ (3,213)
(1,533)
$(4,746)
(1,069)
$(5,815)
*B| @R*y@8 | 229 2³
$483
$2,032
1) Equity-based profit sharing expense and other includes certain profit sharing arrangements in which a portion of performance fees distributed to the general partner are required to be used by employees of Apollo to purchase restricted shares of common stock
or is delivered in the form of RSUS, which are granted under the Equity Plan. Equity-based profit sharing expense and other also includes performance grants which are tied to the Company's receipt of performance fees, within prescribed periods, sufficient to cover
the associated equity-based compensation expense. 2) Transaction-related charges include contingent consideration, equity-based compensation charges and the amortization of intangible assets and certain other charges associated with acquisitions, and
restructuring charges. 3) Merger-related transaction and integration costs includes advisory services, technology integration, equity-based compensation charges and other costs associated with the Company's merger with Athene. 4) Includes one-time equity-
based compensation expense and associated taxes related to the Company's compensation structure reset.
$4,021
(764)
$3,135
77
(72)
(1)
$3,139
51View entire presentation