Apollo Global Management Investor Presentation Deck
Apollo in 2023: Playing on Offense
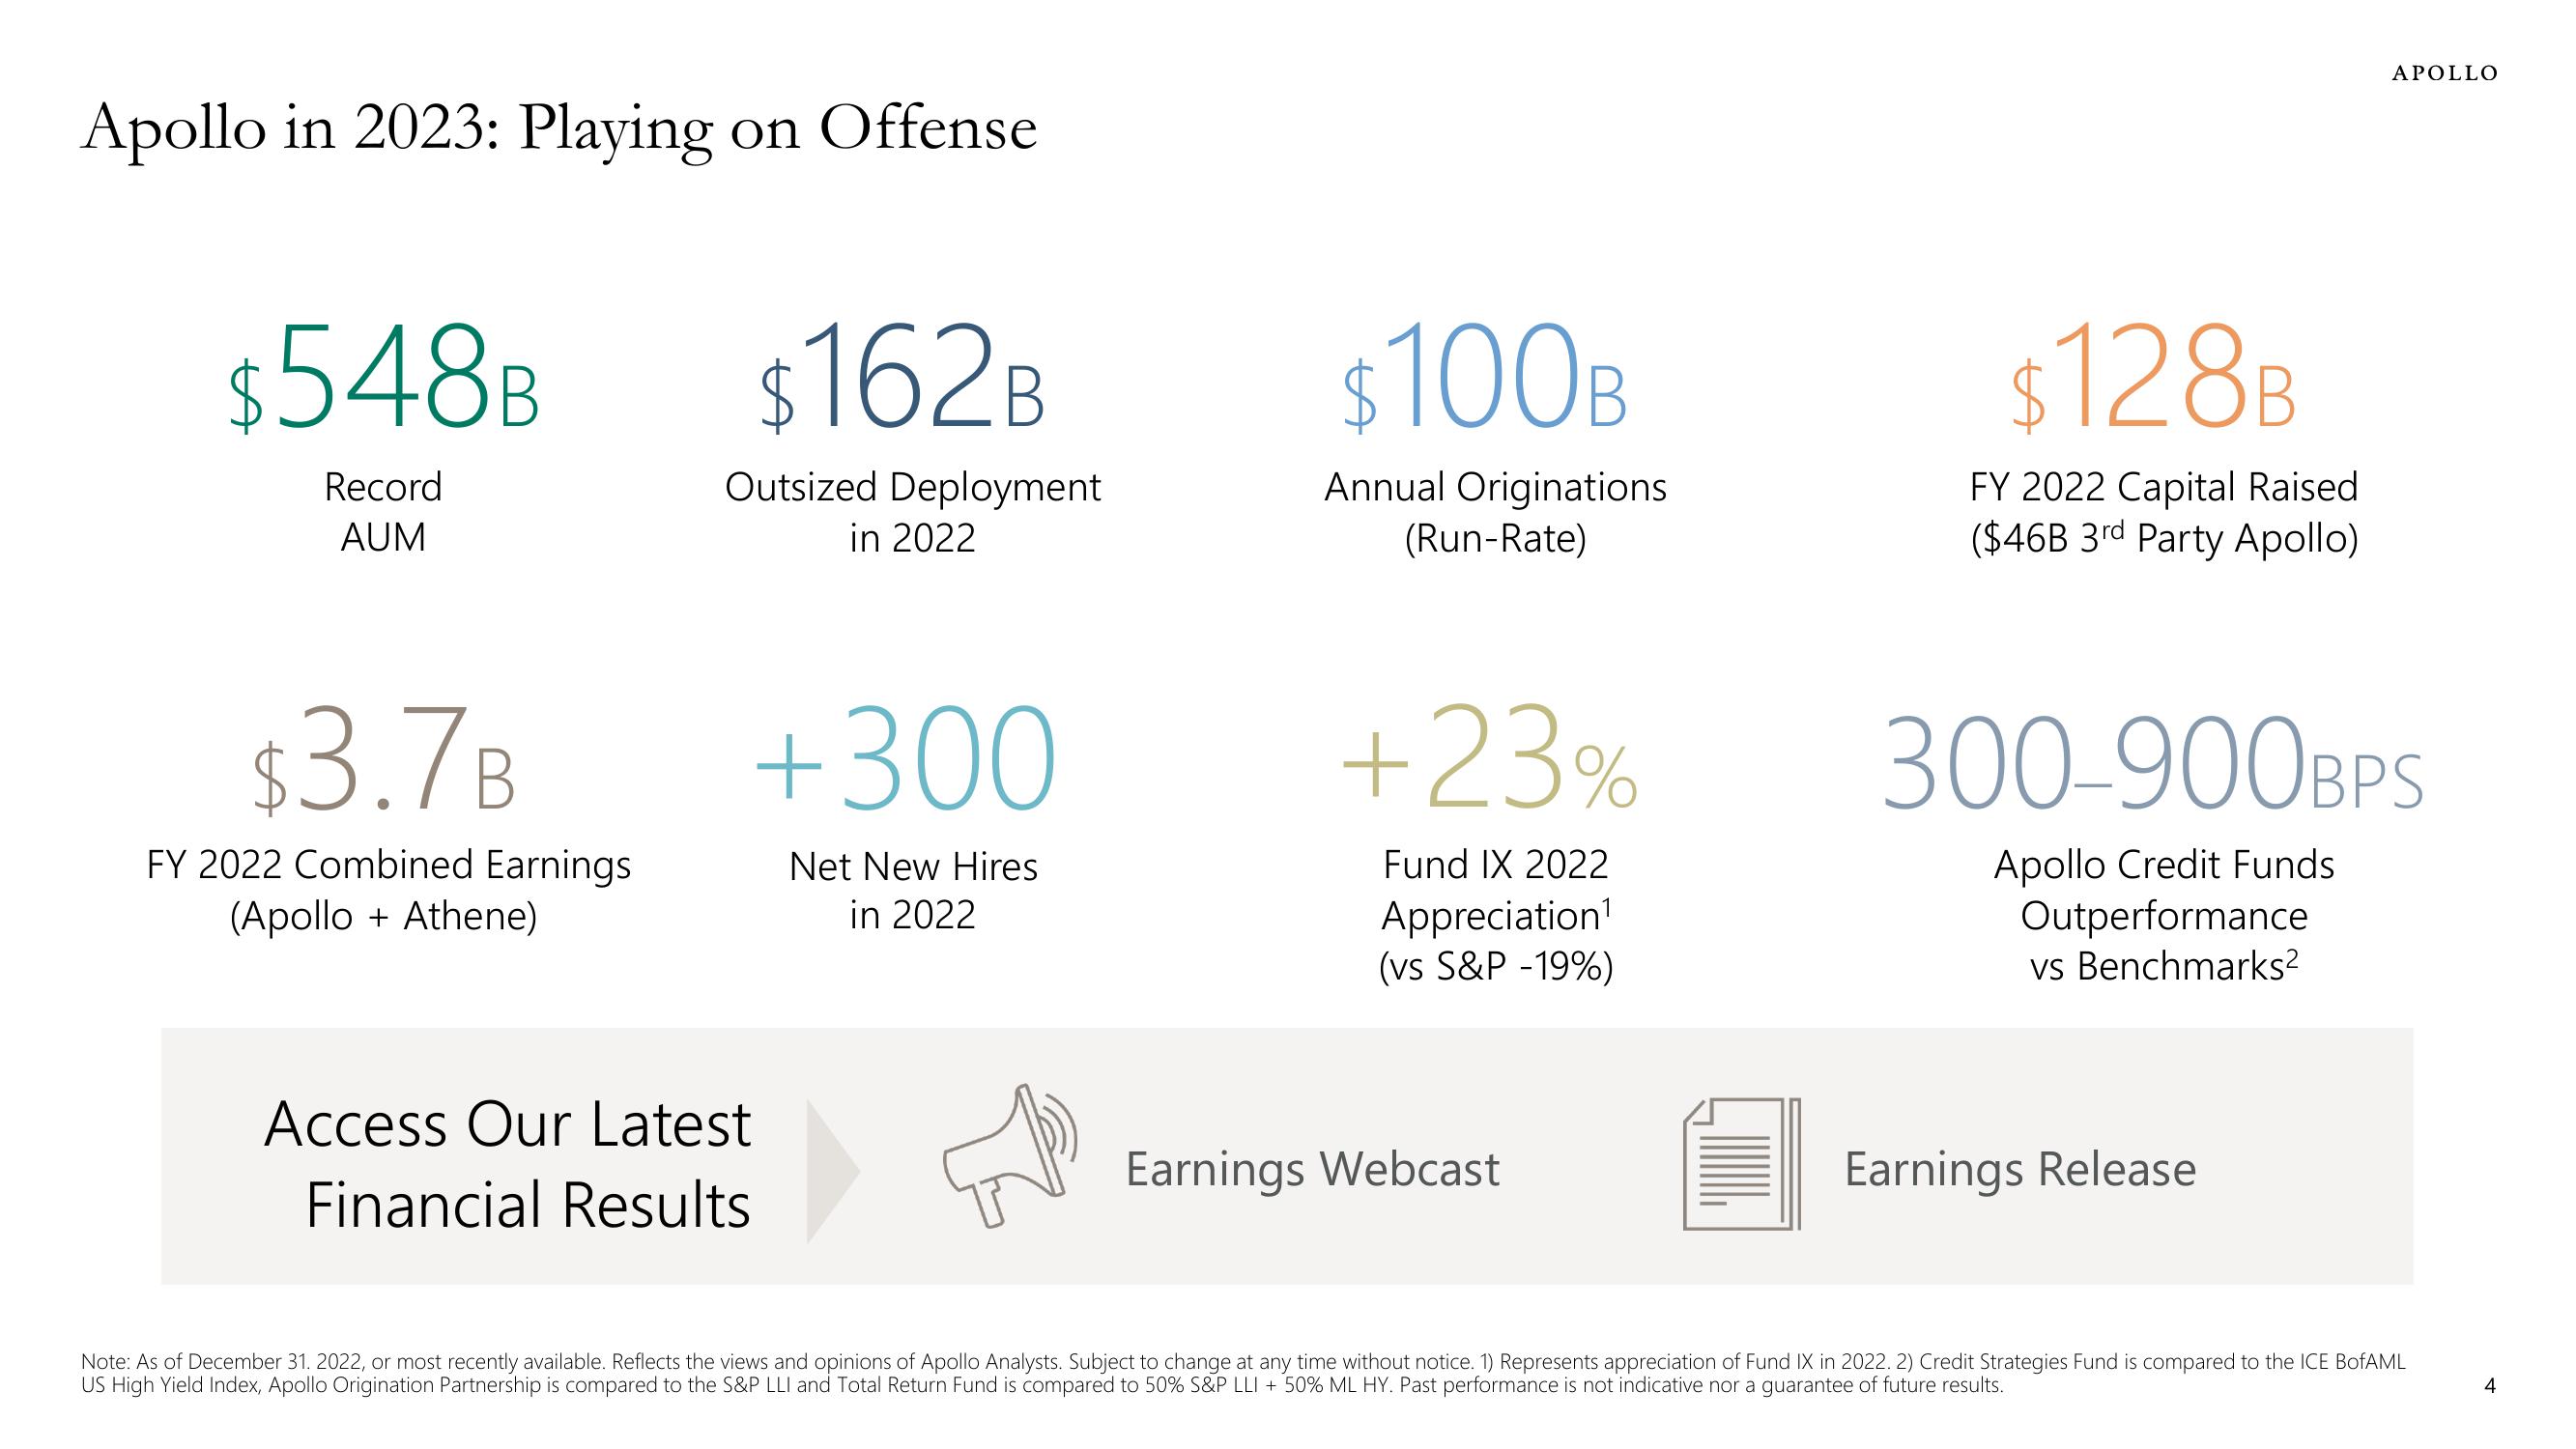
$548B
Record
AUM
$3.7B
FY 2022 Combined Earnings
(Apollo + Athene)
162B
Outsized Deployment
in 2022
+300
Net New Hires
in 2022
Access Our Latest
Financial Results
$100B
Annual Originations
(Run-Rate)
+23%
Fund IX 2022
Appreciation¹
(vs S&P -19%)
Earnings Webcast
$128B
FY 2022 Capital Raised.
($46B 3rd Party Apollo)
APOLLO
300-900BPS
Apollo Credit Funds
Outperformance
vs Benchmarks²
Earnings Release
Note: As of December 31. 2022, or most recently available. Reflects the views and opinions of Apollo Analysts. Subject to change at any time without notice. 1) Represents appreciation of Fund IX in 2022. 2) Credit Strategies Fund is compared to the ICE BofAML
US High Yield Index, Apollo Origination Partnership is compared to the S&P LLI and Total Return Fund is compared to 50% S&P LLI + 50% ML HY. Past performance is not indicative nor a guarantee of future results.
4View entire presentation