Silicon Valley Bank Results Presentation Deck
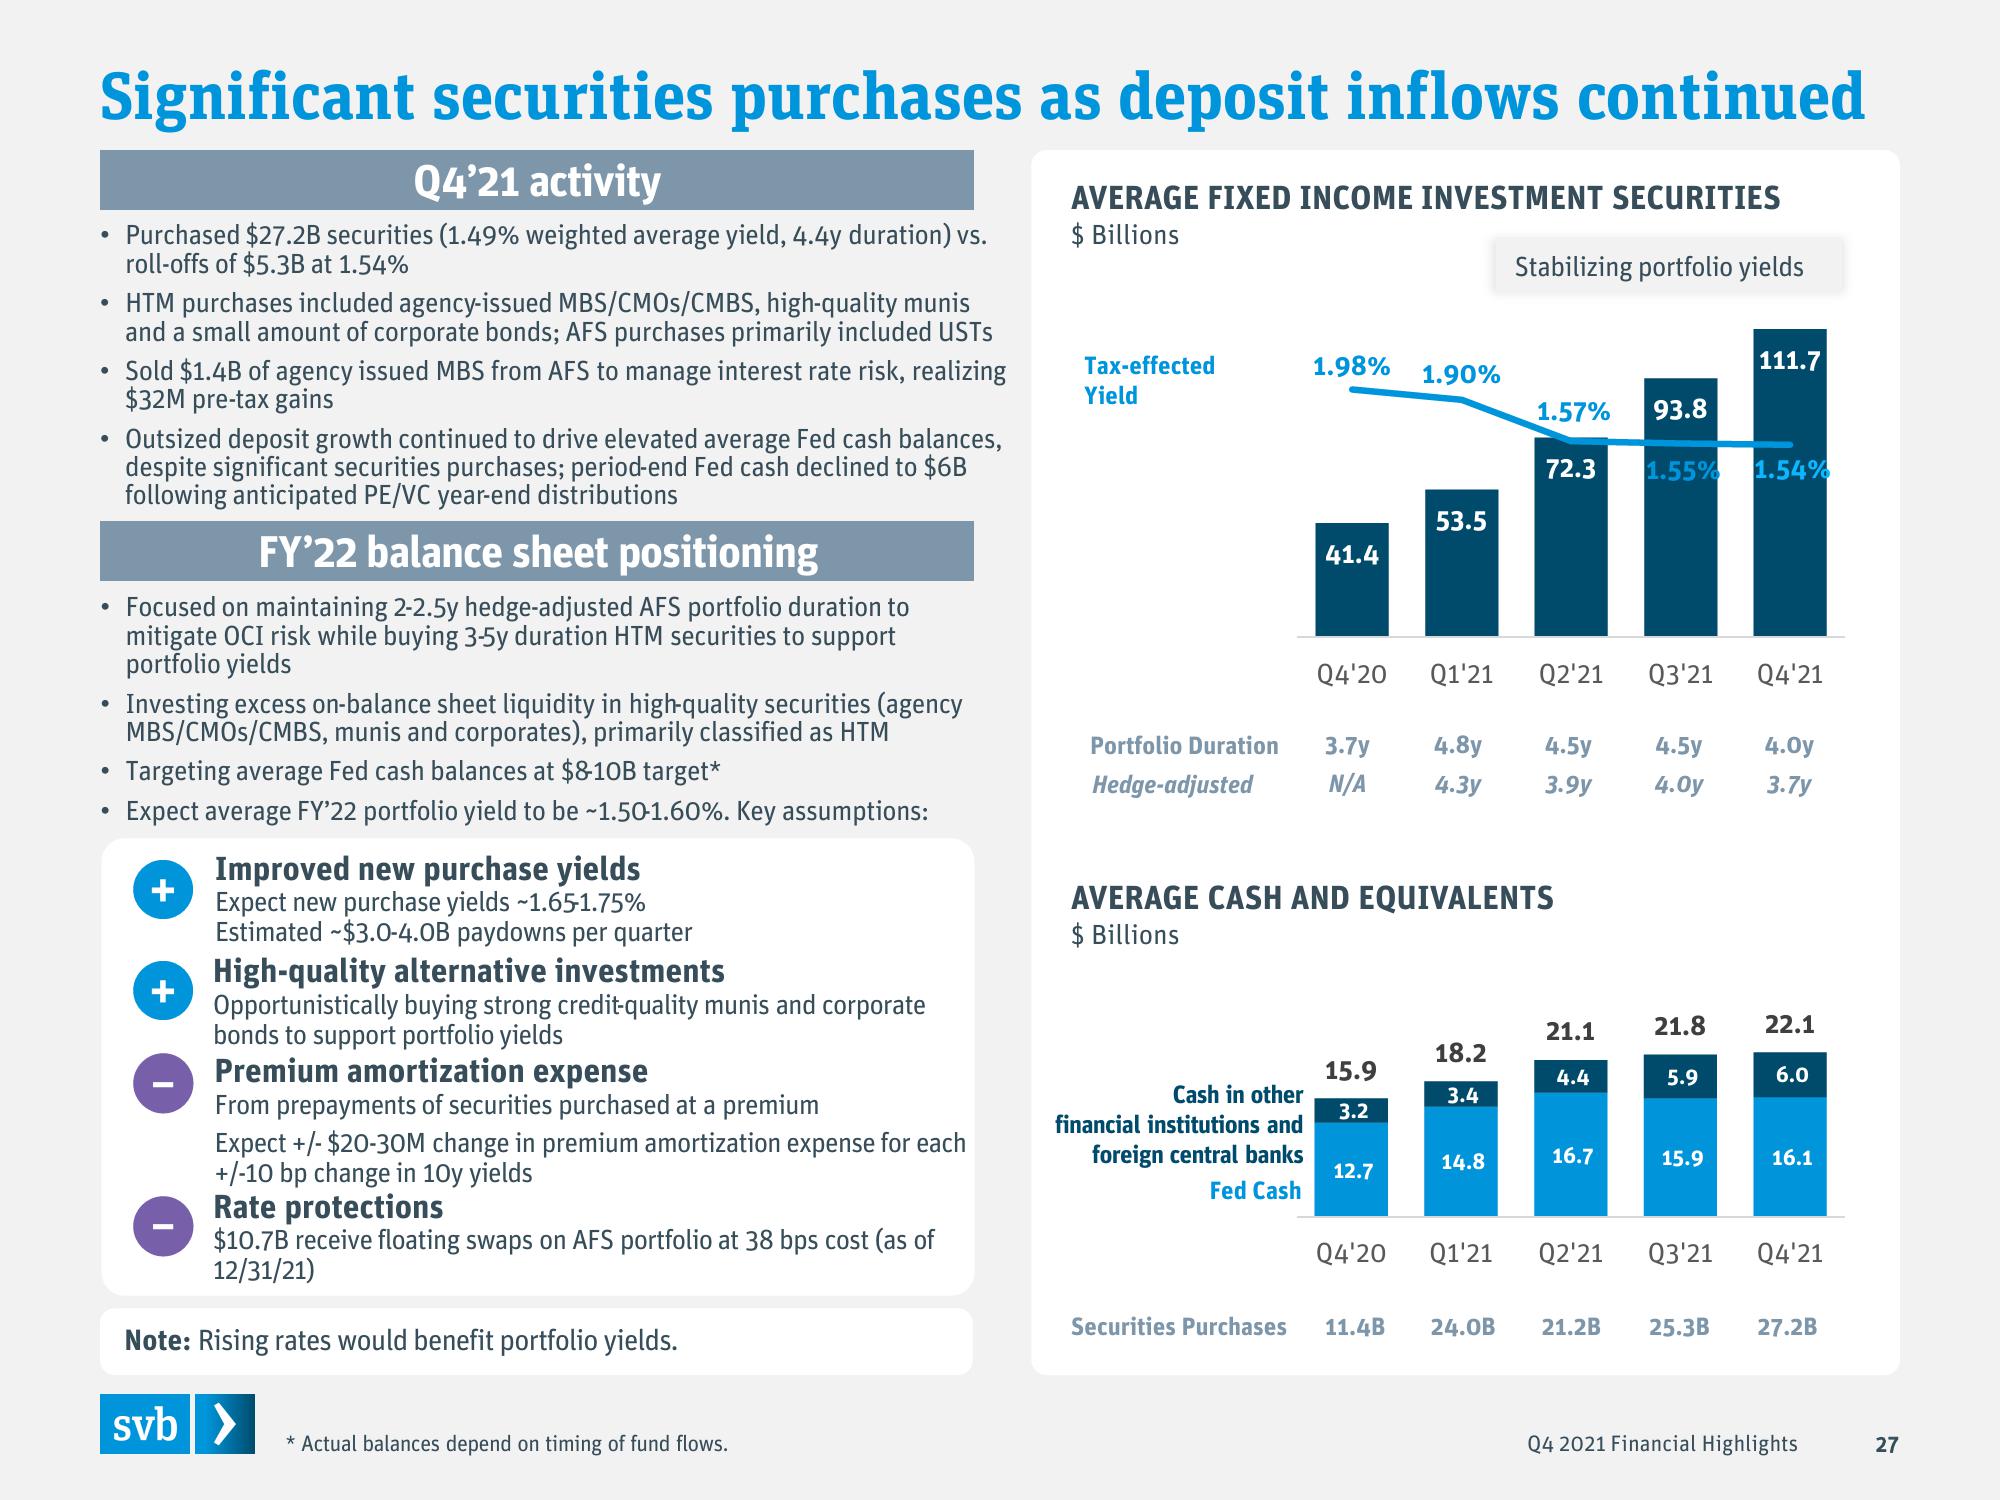
Significant securities purchases as deposit inflows continued
Q4'21 activity
Purchased $27.2B securities (1.49% weighted average yield, 4.4y duration) vs.
roll-offs of $5.3B at 1.54%
●
●
●
●
HTM purchases included agency-issued MBS/CMOS/CMBS, high-quality munis
and a small amount of corporate bonds; AFS purchases primarily included USTS
●
Sold $1.4B of agency issued MBS from AFS to manage interest rate risk, realizing
$32M pre-tax gains
Outsized deposit growth continued to drive elevated average Fed cash balances,
despite significant securities purchases; period-end Fed cash declined to $6B
following anticipated PE/VC year-end distributions
FY'22 balance sheet positioning
• Focused on maintaining 2-2.5y hedge-adjusted AFS portfolio duration to
mitigate OCI risk while buying 3-5y duration HTM securities to support
portfolio yields
Investing excess on-balance sheet liquidity in high-quality securities (agency
MBS/CMOS/CMBS, munis and corporates), primarily classified as HTM
Targeting average Fed cash balances at $8-10B target*
Expect average FY'22 portfolio yield to be ~1.50-1.60%. Key assumptions:
+
Improved new purchase yields
Expect new purchase yields ~1.65-1.75%
Estimated $3.0-4.0B paydowns per quarter
High-quality alternative investments
Opportunistically buying strong credit-quality munis and corporate
bonds to support portfolio yields
Premium amortization expense
From prepayments of securities purchased at a premium
Expect +/- $20-30M change in premium amortization expense for each
+/-10 bp change in 10y yields
Rate protections
$10.7B receive floating swaps on AFS portfolio at 38 bps cost (as of
12/31/21)
Note: Rising rates would benefit portfolio yields.
svb >
* Actual balances depend on timing of fund flows.
AVERAGE FIXED INCOME INVESTMENT SECURITIES
$ Billions
Stabilizing portfolio yields
Tax-effected
Yield
1.98%
Cash in other
financial institutions and
foreign central banks
Fed Cash
41.4
Securities Purchases
Q4'20
Portfolio Duration 3.7y 4.8y
Hedge-adjusted N/A
4.3y
15.9
3.2
1.90%
12.7
53.5
Q4'20
AVERAGE CASH AND EQUIVALENTS
$ Billions
Q1'21 Q2'21
18.2
3.4
14.8
1.57% 93.8
Q1'21
72.3
11.4B 24.0B
4.5y
4.5y
3.9y 4.0y
21.1
4.4
16.7
1.55%
Q2'21
Q3'21
21.8
5.9
15.9
111.7
1.54%
Q4'21
4.0y
3.7y
22.1
6.0
16.1
Q3'21 Q4'21
21.2B 25.3B 27.2B
Q4 2021 Financial Highlights
27View entire presentation