Vivid Seats Results Presentation Deck
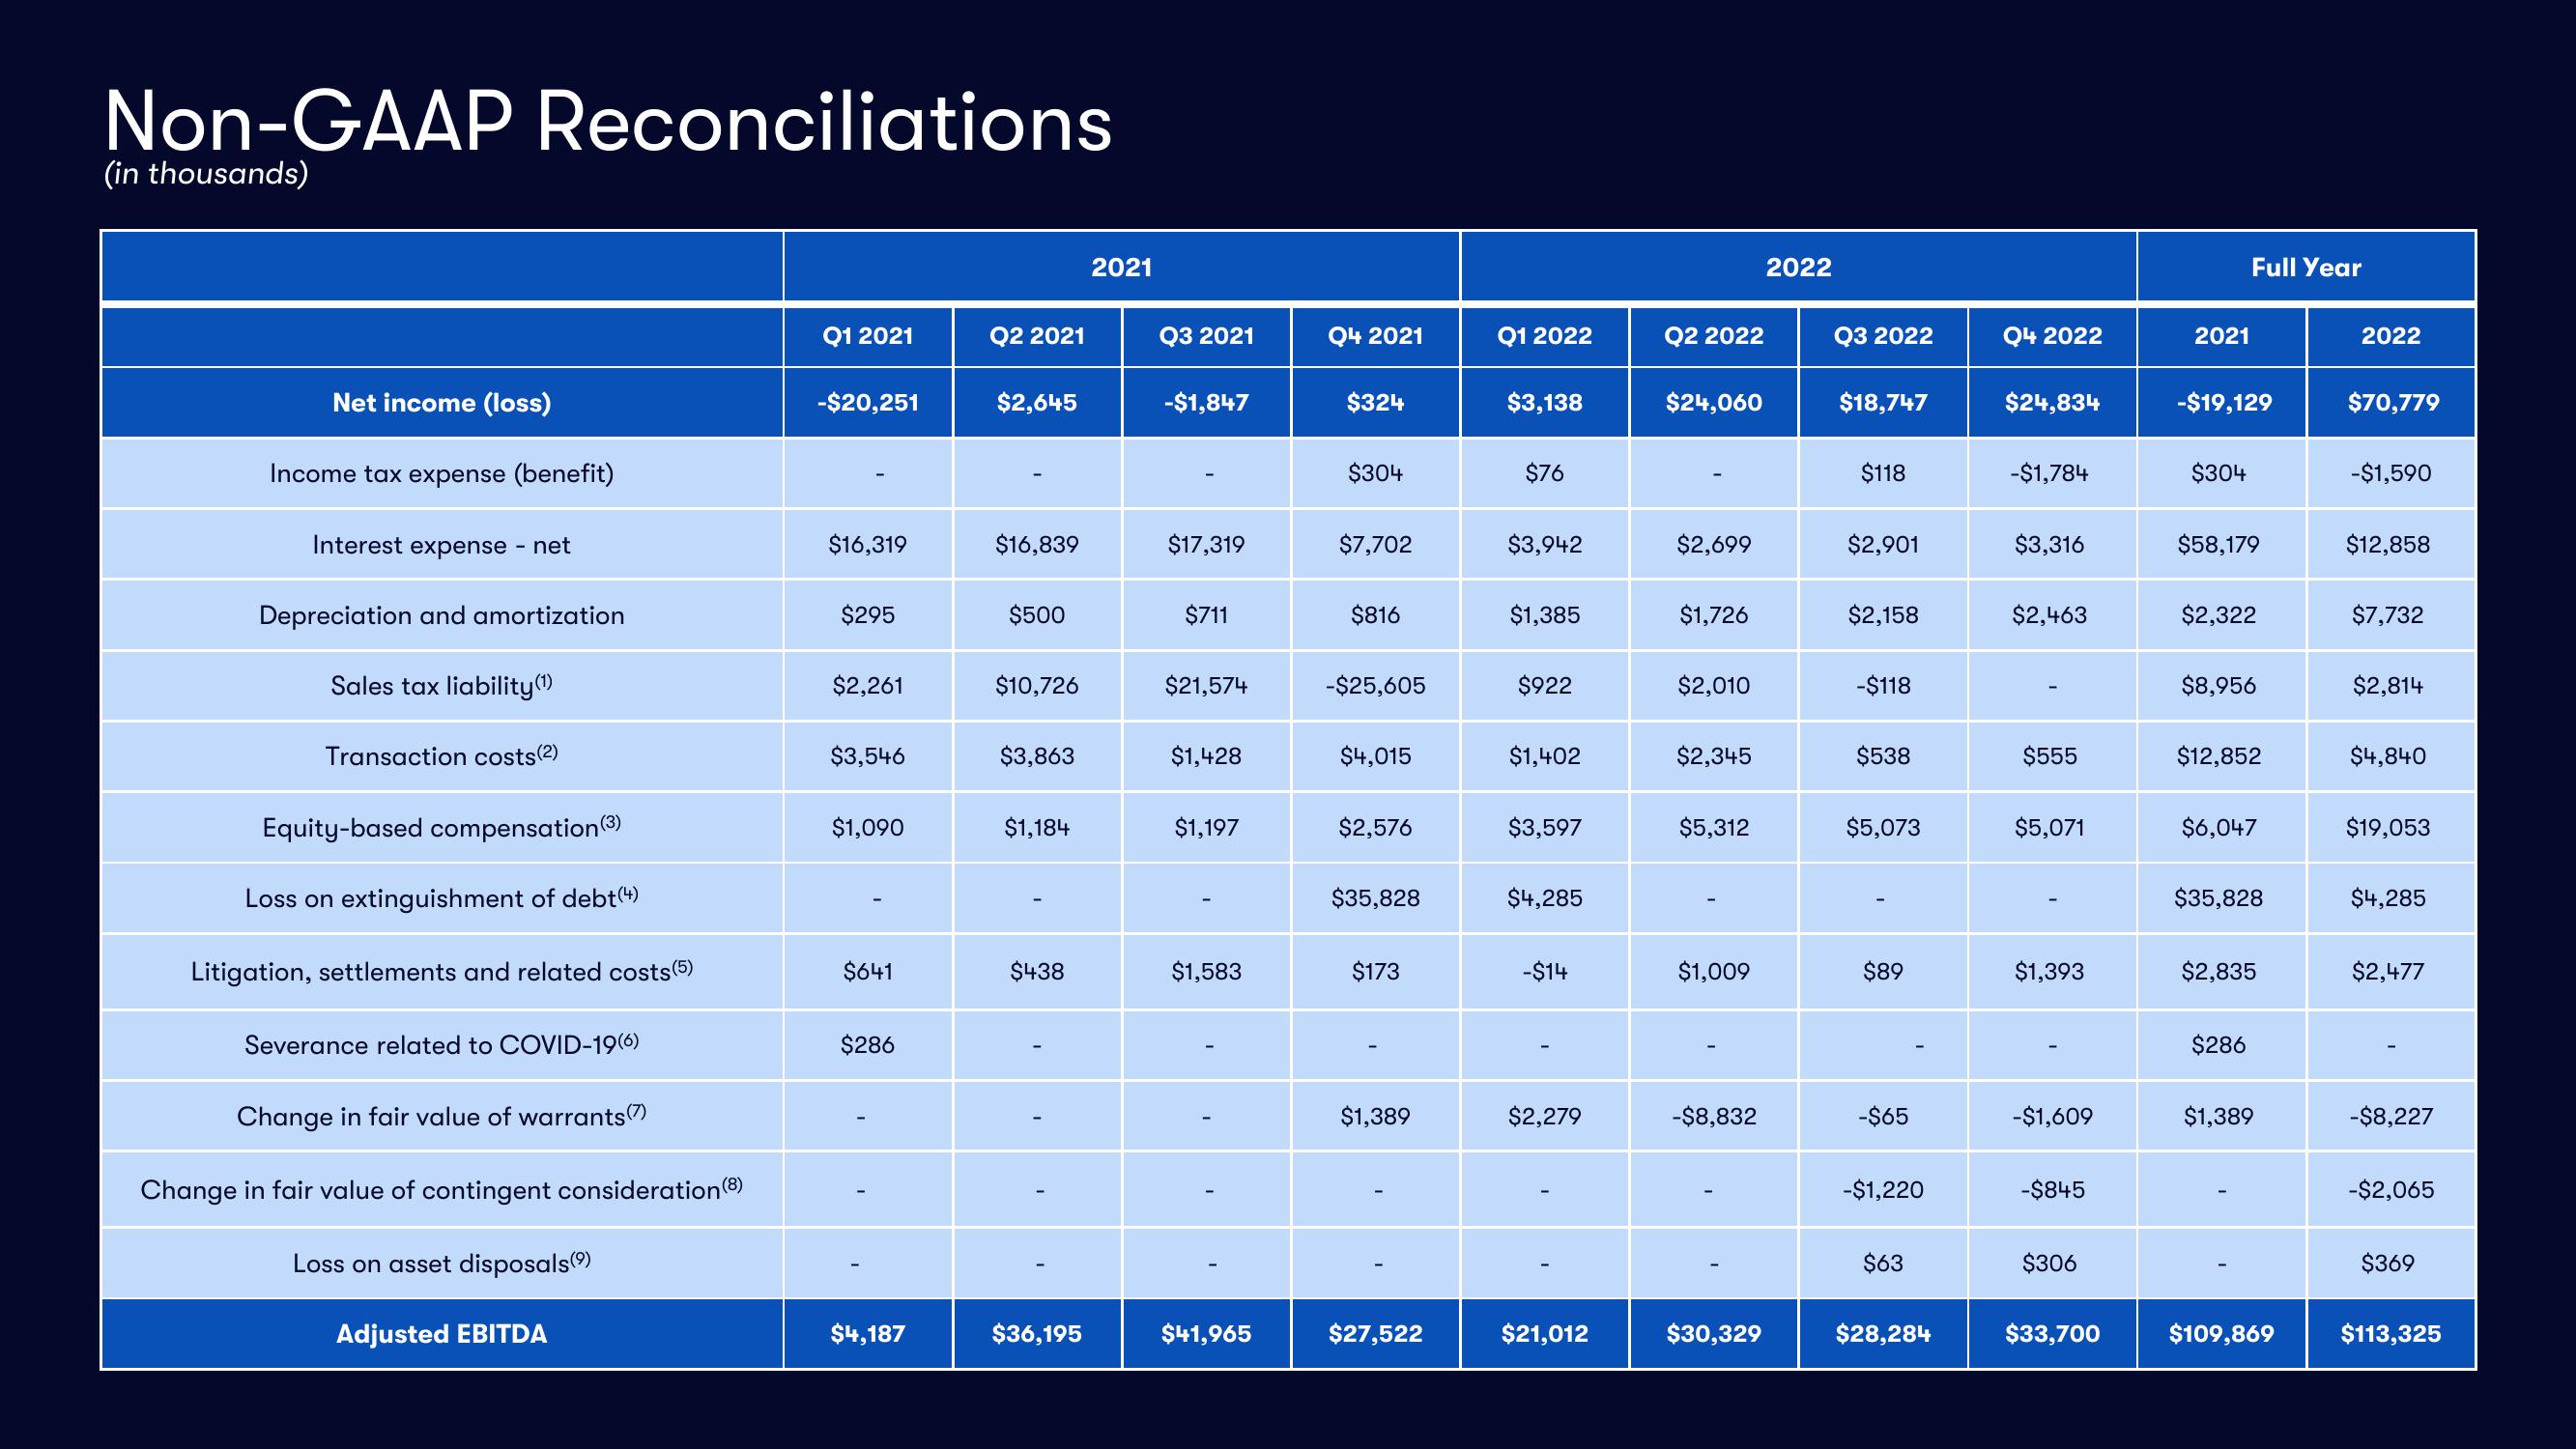
Non-GAAP Reconciliations
(in thousands)
Net income (loss)
Income tax expense (benefit)
Interest expense - net
Depreciation and amortization
Sales tax liability (1)
Transaction costs (2)
Equity-based compensation (3)
Loss on extinguishment of debt (4)
Litigation, settlements and related costs (5)
Severance related to COVID-19(6)
Change in fair value of warrants (7)
Change in fair value of contingent consideration (8)
Loss on asset disposals (⁹)
Adjusted EBITDA
Q1 2021
-$20,251
$16,319
$295
$2,261
$3,546
$1,090
$641
$286
$4,187
Q2 2021
$2,645
$16,839
$500
$10,726
$3,863
$1,184
$438
1
$36,195
2021
Q3 2021
-$1,847
$17,319
$711
$21,574
$1,428
$1,197
$1,583
$41,965
Q4 2021
$324
$304
$7,702
$816
-$25,605
$4,015
$2,576
$35,828
$173
$1,389
$27,522
Q1 2022
$3,138
$76
$3,942
$1,385
$922
$1,402
$3,597
$4,285
-$14
$2,279
$21,012
Q2 2022
$24,060
$2,699
$1,726
$2,010
$2,345
$5,312
$1,009
-$8,832
$30,329
2022
Q3 2022
$18,747
$118
$2,901
$2,158
-$118
$538
$5,073
$89
-$65
-$1,220
$63
$28,284
Q4 2022
$24,834
-$1,784
$3,316
$2,463
$555
$5,071
$1,393
-$1,609
-$845
$306
$33,700
2021
-$19,129
$304
Full Year
$58,179
$2,322
$8,956
$12,852
$6,047
$35,828
$2,835
$286
$1,389
$109,869
2022
$70,779
-$1,590
$12,858
$7,732
$2,814
$4,840
$19,053
$4,285
$2,477
-$8,227
-$2,065
$369
$113,325View entire presentation