Rent The Runway Results Presentation Deck
Demonstrating Our Operating Leverage with Scale
Revenue:
A in % of
Revenue
from Q1'21
to Q2'22
$34M
➡>>
(19)%
Q1 '21
Adj. EBITDA
Margin
Q1 2021 Q2 2022
(4)%
Fulfillment
23 %
Rental Product
Depreciation
and Revenue
Share
(4)%
9%
Marketing Technology
18%
G&A
(21)%
EBITDA
Adjustments
$77M
2%
Q2 '22
Adj. EBITDA
Margin
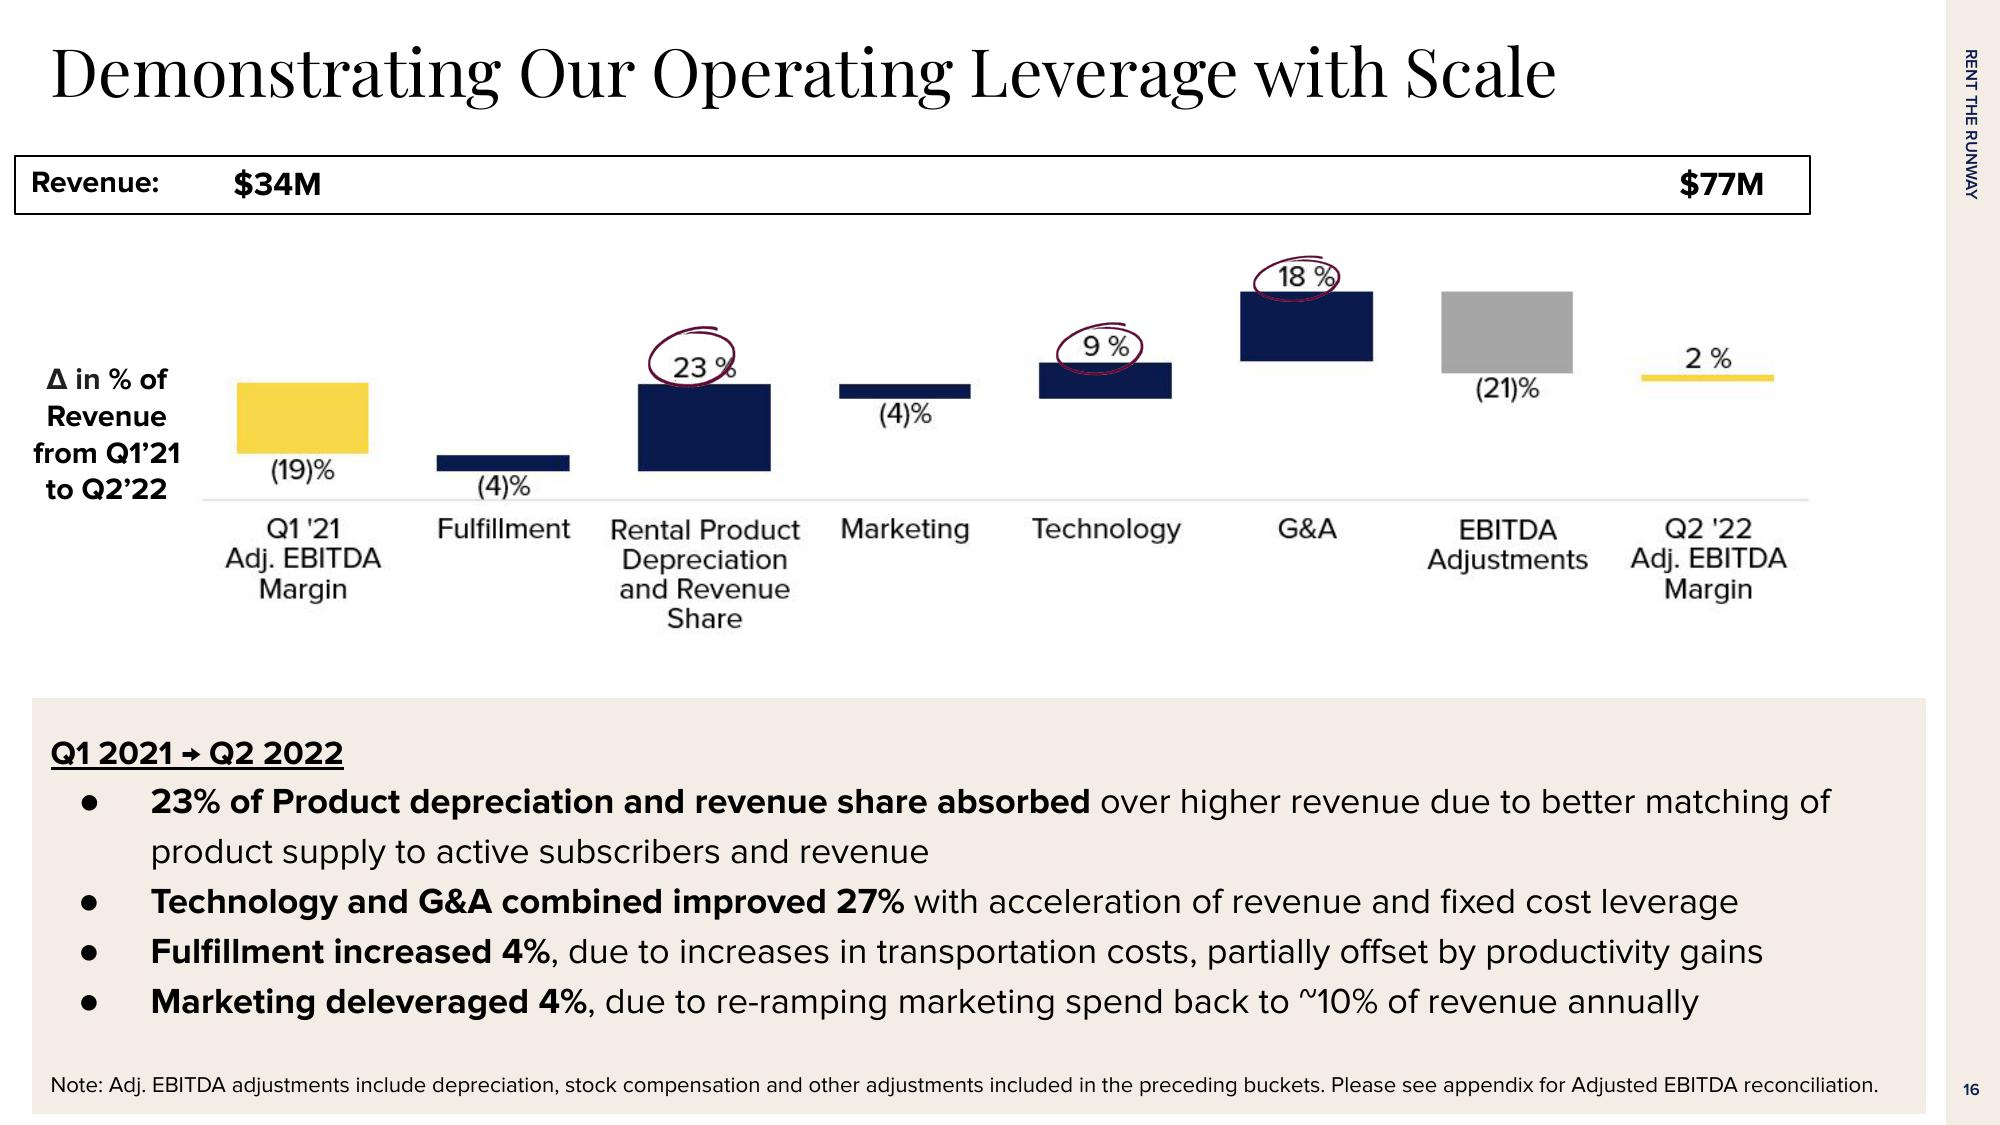
23% of Product depreciation and revenue share absorbed over higher revenue due to better matching of
product supply to active subscribers and revenue
Technology and G&A combined improved 27% with acceleration of revenue and fixed cost leverage
Fulfillment increased 4%, due to increases in transportation costs, partially offset by productivity gains
Marketing deleveraged 4%, due to re-ramping marketing spend back to ~10% of revenue annually
Note: Adj. EBITDA adjustments include depreciation, stock compensation and other adjustments included in the preceding buckets. Please see appendix for Adjusted EBITDA reconciliation.
RENT THE RUNWAY
16View entire presentation