Investor Presentation
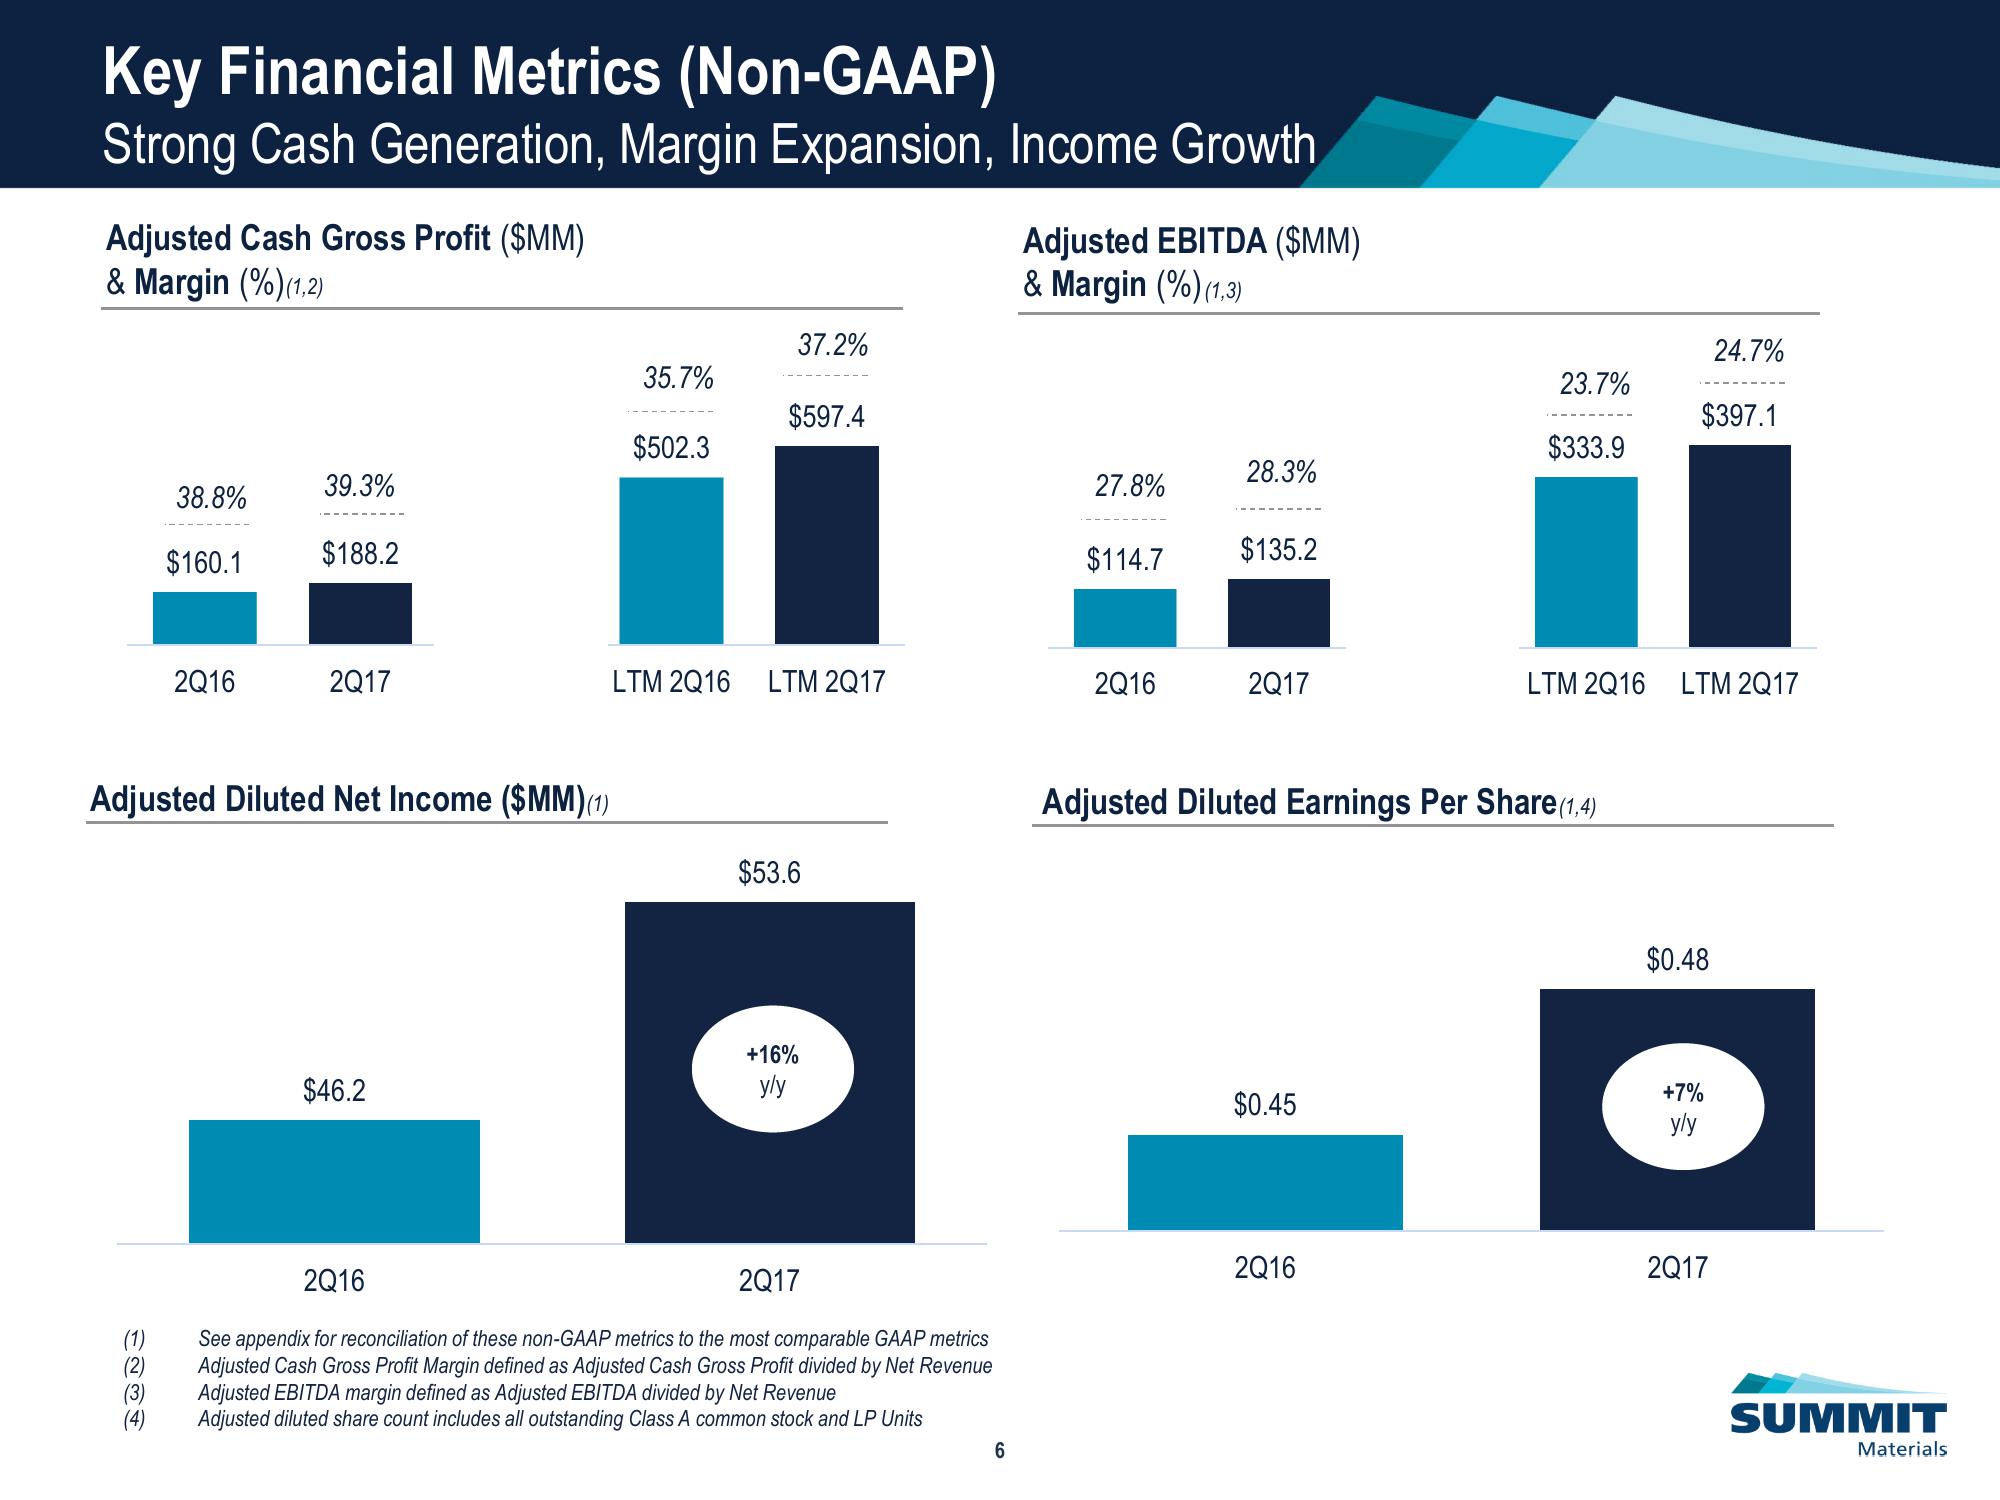
Key Financial Metrics (Non-GAAP)
Strong Cash Generation, Margin Expansion, Income Growth
Adjusted Cash Gross Profit ($MM)
& Margin (%) (1.2)
୧୯୭
38.8%
$160.1
(3)
2Q16
39.3%
$188.2
Adjusted Diluted Net Income ($MM) (1)
2Q17
$46.2
35.7%
$502.3
37.2%
$597.4
LTM 2Q16 LTM 2Q17
$53.6
+16%
yly
2Q16
2Q17
See appendix for reconciliation of these non-GAAP metrics to the most comparable GAAP metrics
Adjusted Cash Gross Profit Margin defined as Adjusted Cash Gross Profit divided by Net Revenue
Adjusted EBITDA margin defined as Adjusted EBITDA divided by Net Revenue
Adjusted diluted share count includes all outstanding Class A common stock and LP Units
6
Adjusted EBITDA ($MM)
& Margin (%) (1.3)
27.8%
$114.7
2Q16
28.3%
$135.2
2Q17
$0.45
23.7%
$333.9
Adjusted Diluted Earnings Per Share (1,4)
2Q16
$397.1
LTM 2Q16 LTM 2Q17
$0.48
24.7%
+7%
yly
2Q17
SUMMIT
MaterialsView entire presentation