Chimerix Investor Conference Presentation Deck
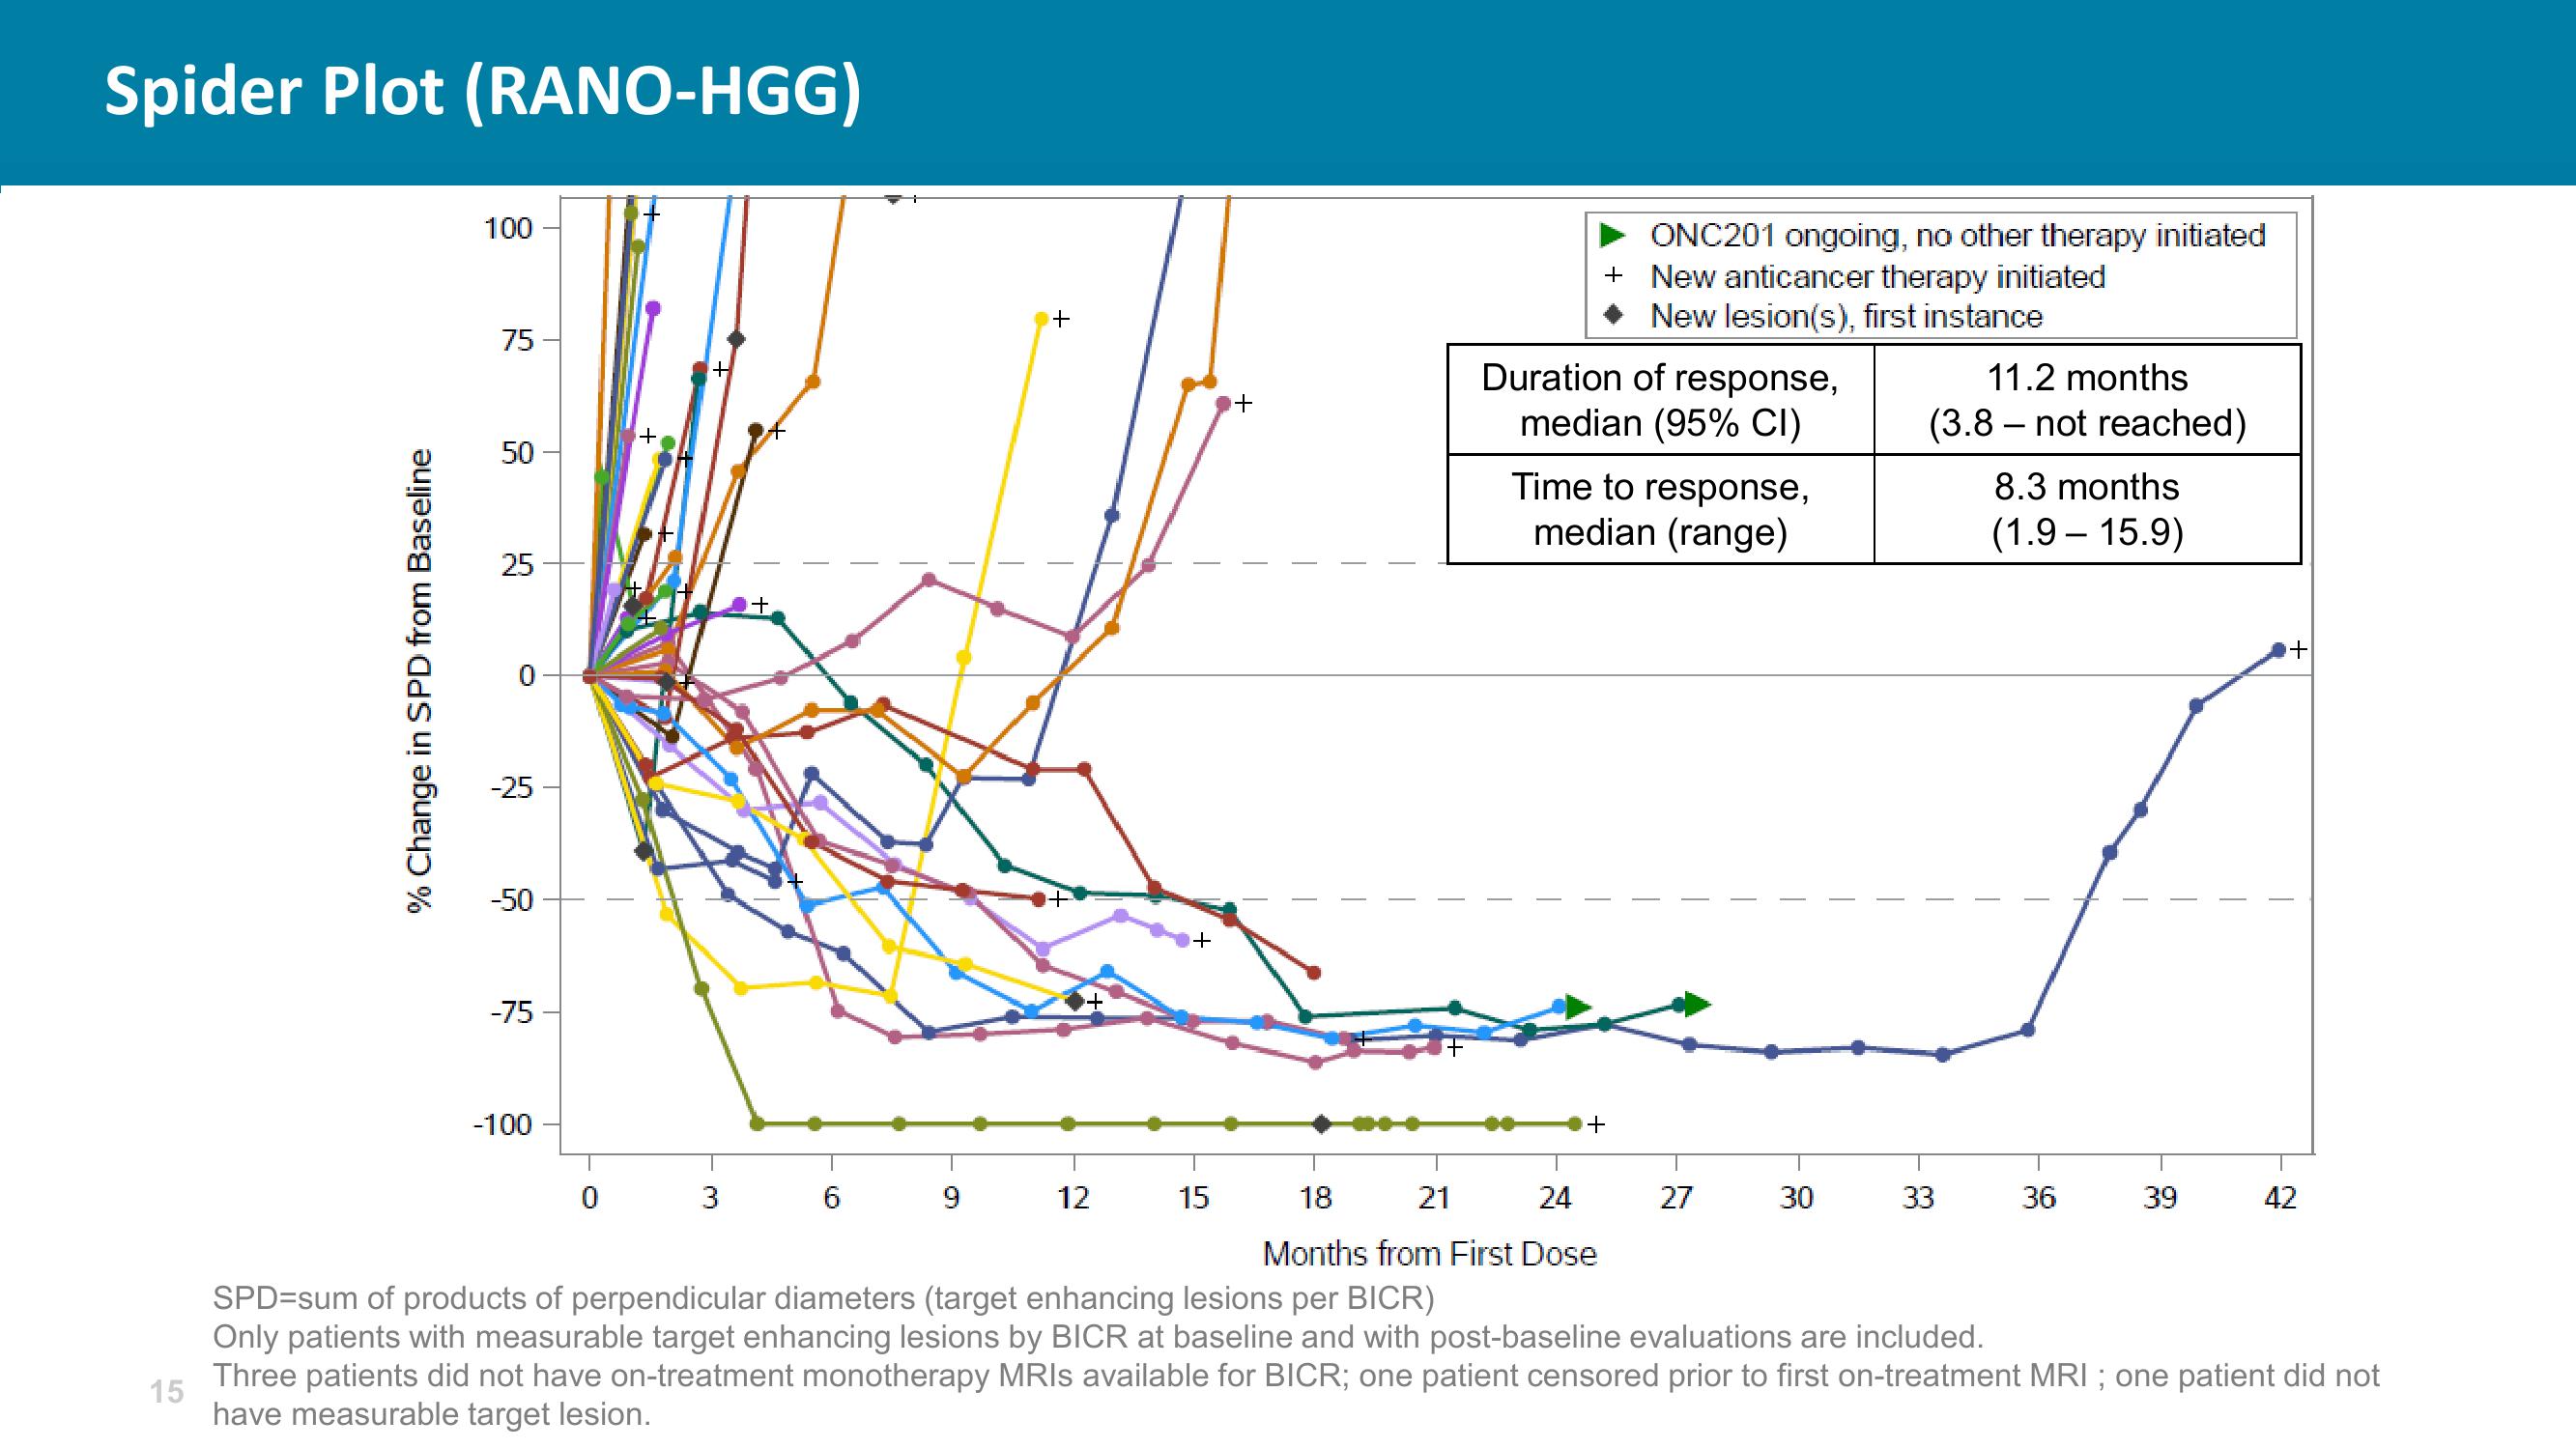
Spider Plot (RANO-HGG)
15
% Change in SPD from Baseline
100
75
50
25
O
-25
-50
-75
-100
+
H
3
6
+
9
+
+
12
+
15
ONC201 ongoing, no other therapy initiated
+ New anticancer therapy initiated
New lesion(s), first instance
Duration of response,
median (95% CI)
Time to response,
median (range)
18 21
24
Months from First Dose
SPD=sum of products of perpendicular diameters (target enhancing lesions per BICR)
Only patients with measurable target enhancing lesions by BICR at baseline and with post-baseline evaluations are included.
Three patients did not have on-treatment monotherapy MRIs available for BICR; one patient censored prior to first on-treatment MRI ; one patient did not
have measurable target lesion.
+
27
11.2 months
(3.8 - not reached)
30
8.3 months
(1.9 - 15.9)
33
36
+
39
42View entire presentation