Silicon Valley Bank Results Presentation Deck
Repositioned securities portfolio to take advantage of rising rates
Q1'22 activity
Monetized $204M gains from $5B AFS hedges and sold underlying hedged
securities, resulting in a net gain of $49M
●
●
FY'22 securities strategy
Primarily investing in government/agency-guaranteed securities, emphasizing
AFS purchases in the near term to maximize ALM flexibility and satisfy LFI
liquidity requirements
●
Reinvested AFS sale proceeds and HTM paydowns, purchasing $10B securities
(primarily USTs and agency MBS) at improved yields (2.22% weighted average
new purchase yield, 4.3y duration)
●
Buying -3.5y securities as flat to inverted yield curve limits benefit of extending
duration
• Expect average FY'22 portfolio yield to be ~1.80-1.90%. Key assumptions:
Improved new purchase yields
Expect new purchase yields -2.50-2.75% (vs. 1.65-1.75% at 1/20/22)
Estimated $2.0-3.0B paydowns per quarter
High-quality credit investments
Opportunistically buying strong credit-quality munis and corporate bonds
in HTM to support portfolio yields
Premium amortization expense
From prepayments of securities purchased at a premium
If 10-year UST dropped below 2%, expect an in-year increase in premium
amortization expense of $40-60M
Rate protections
$6B receive-floating swaps on AFS portfolio at 8 bps cost (as of 3/31/22)
svb>
* Actual balances depend on timing of fund flows.
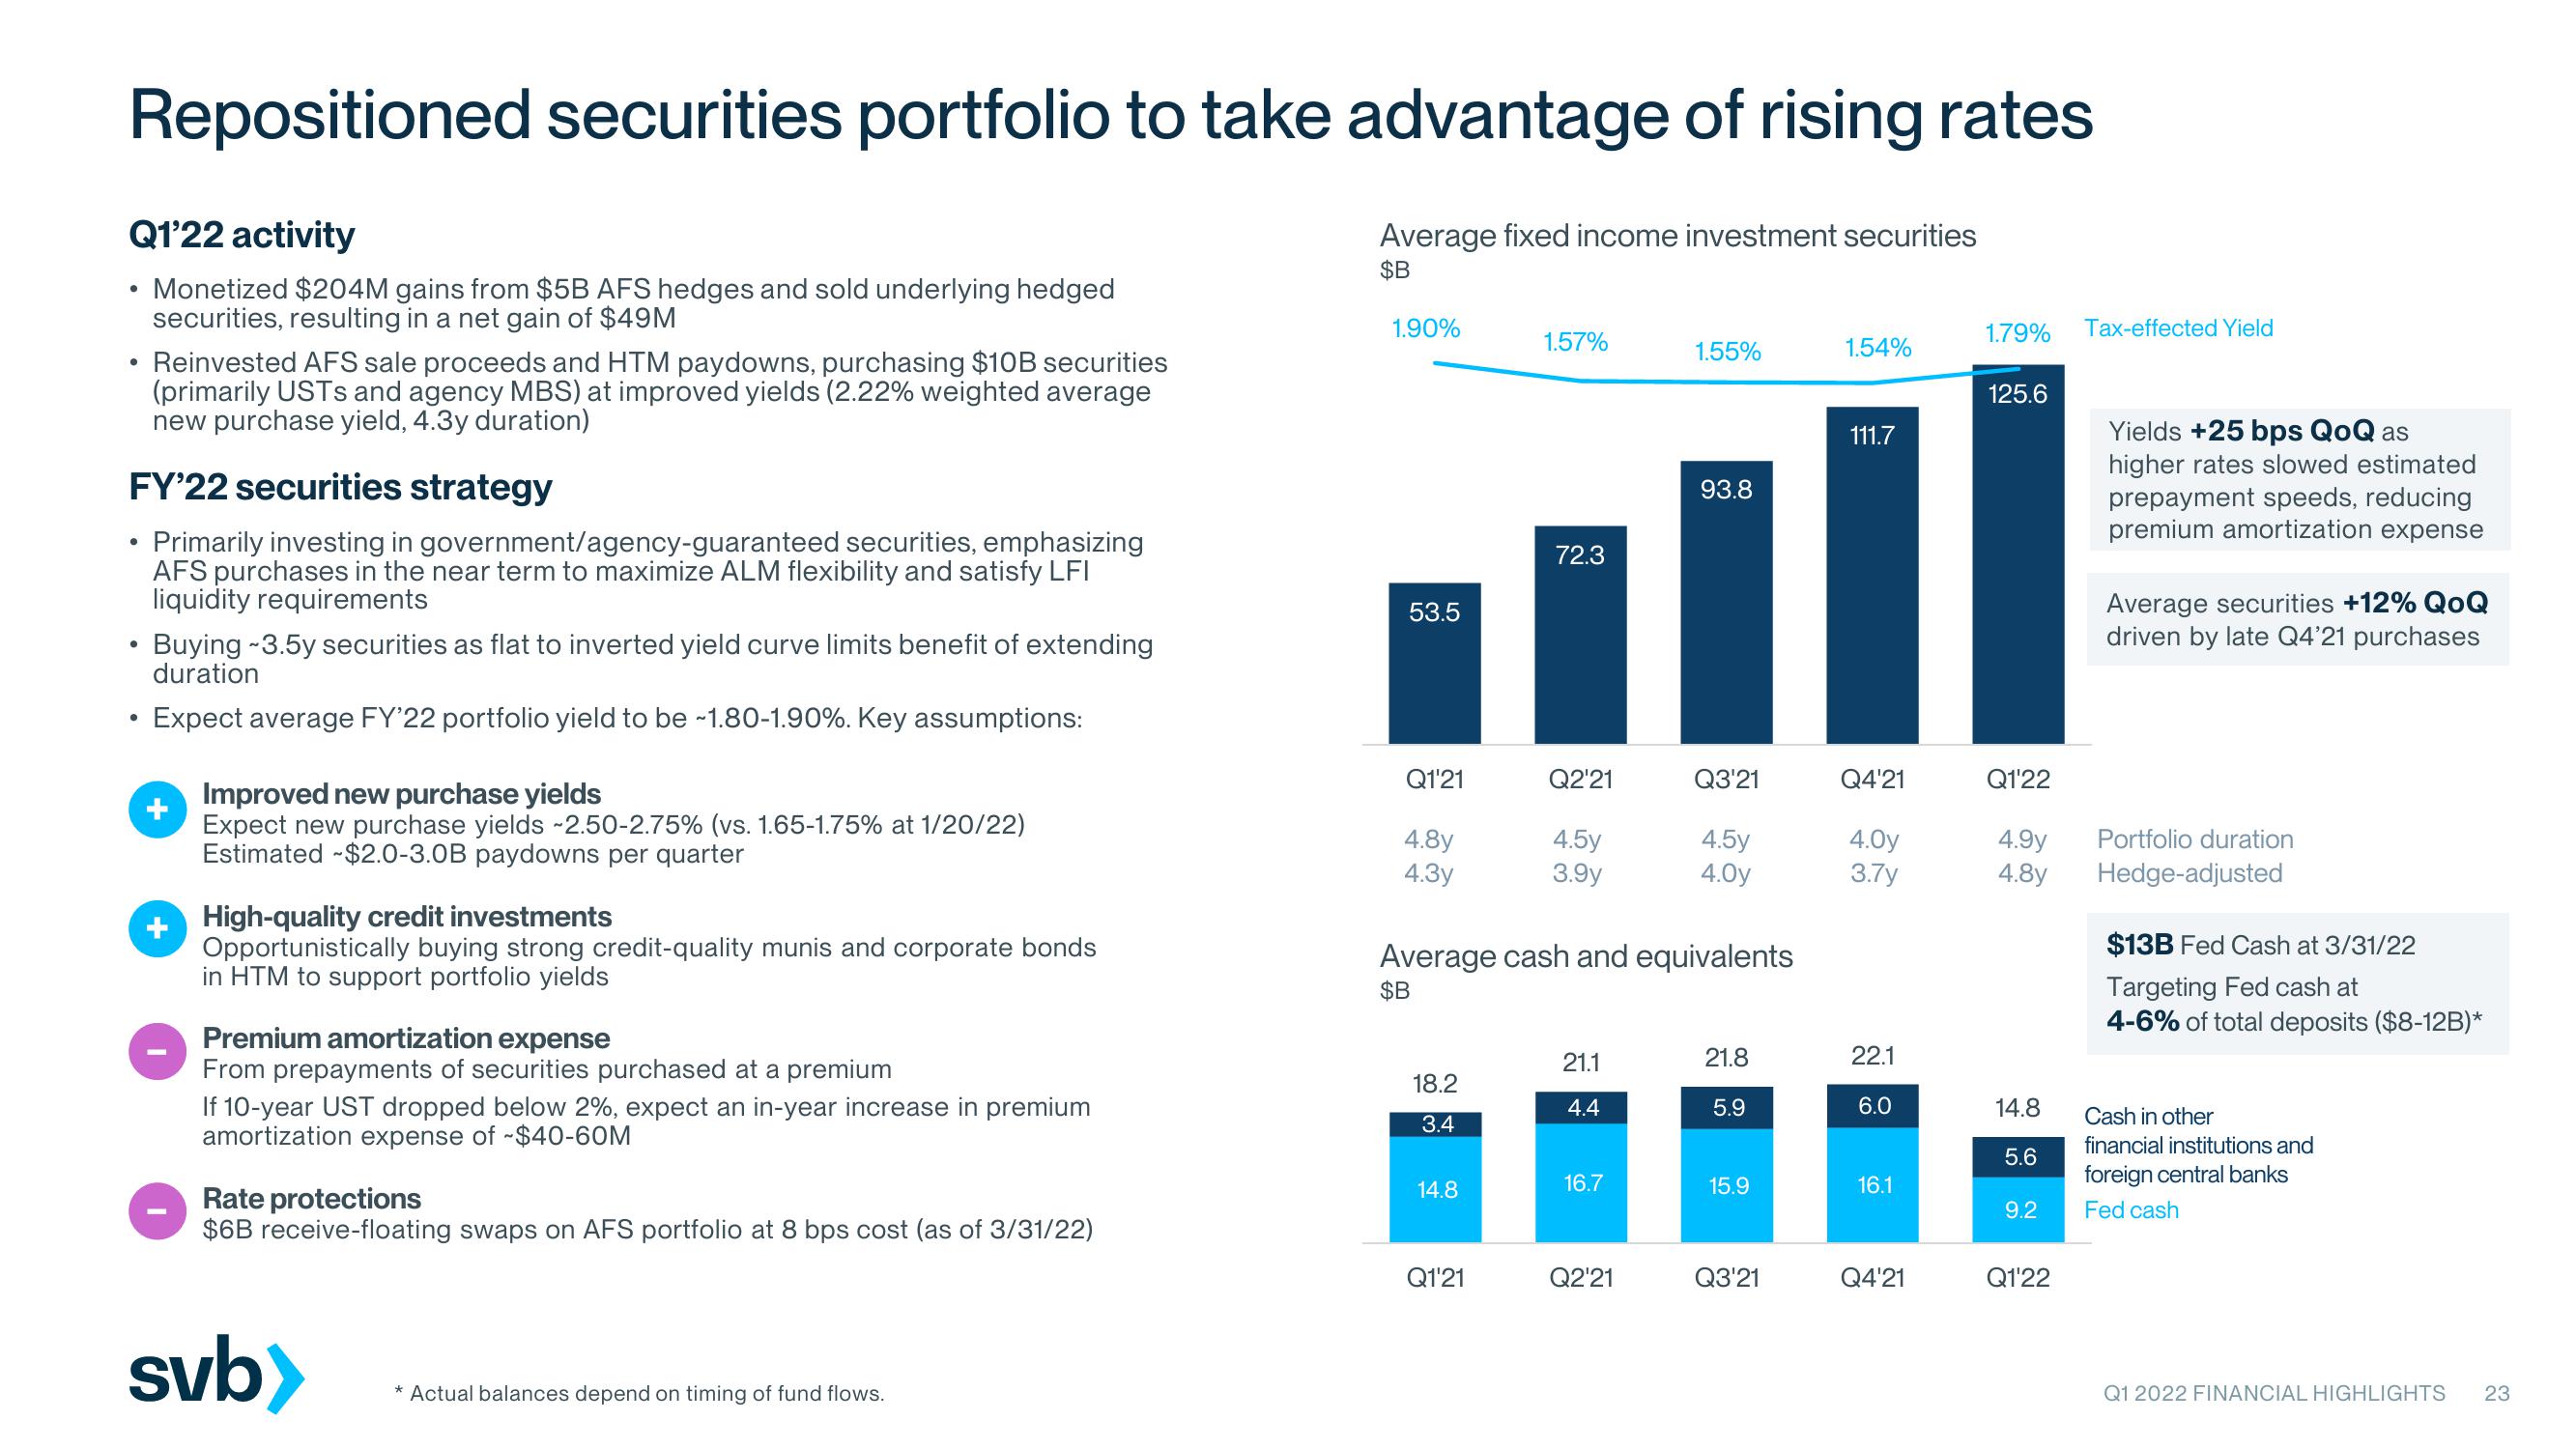
Average fixed income investment securities
$B
1.90%
53.5
Q1'21
4.8y
4.3y
18.2
3.4
14.8
1.57%
Q1'21
Q2'21
Average cash and equivalents
$B
1.55%
111.7
93.8
72.3
all
Q3'21
Q4'21
4.5y
3.9y
21.1
4.4
16.7
4.5y
4.0y
Q2'21
21.8
5.9
15.9
1.54%
Q3'21
4.0y
3.7y
22.1
6.0
16.1
1.79% Tax-effected Yield
Q4'21
125.6
Q1'22
4.9y
4.8y
14.8
5.6
9.2
Q1'22
Yields +25 bps QoQ as
higher rates slowed estimated
prepayment speeds, reducing
premium amortization expense
Average securities +12% QOQ
driven by late Q4'21 purchases
Portfolio duration
Hedge-adjusted
$13B Fed Cash at 3/31/22
Targeting Fed cash at
4-6% of total deposits ($8-12B)*
Cash in other
financial institutions and
foreign central banks
Fed cash
Q1 2022 FINANCIAL HIGHLIGHTS 23View entire presentation