Silicon Valley Bank Results Presentation Deck
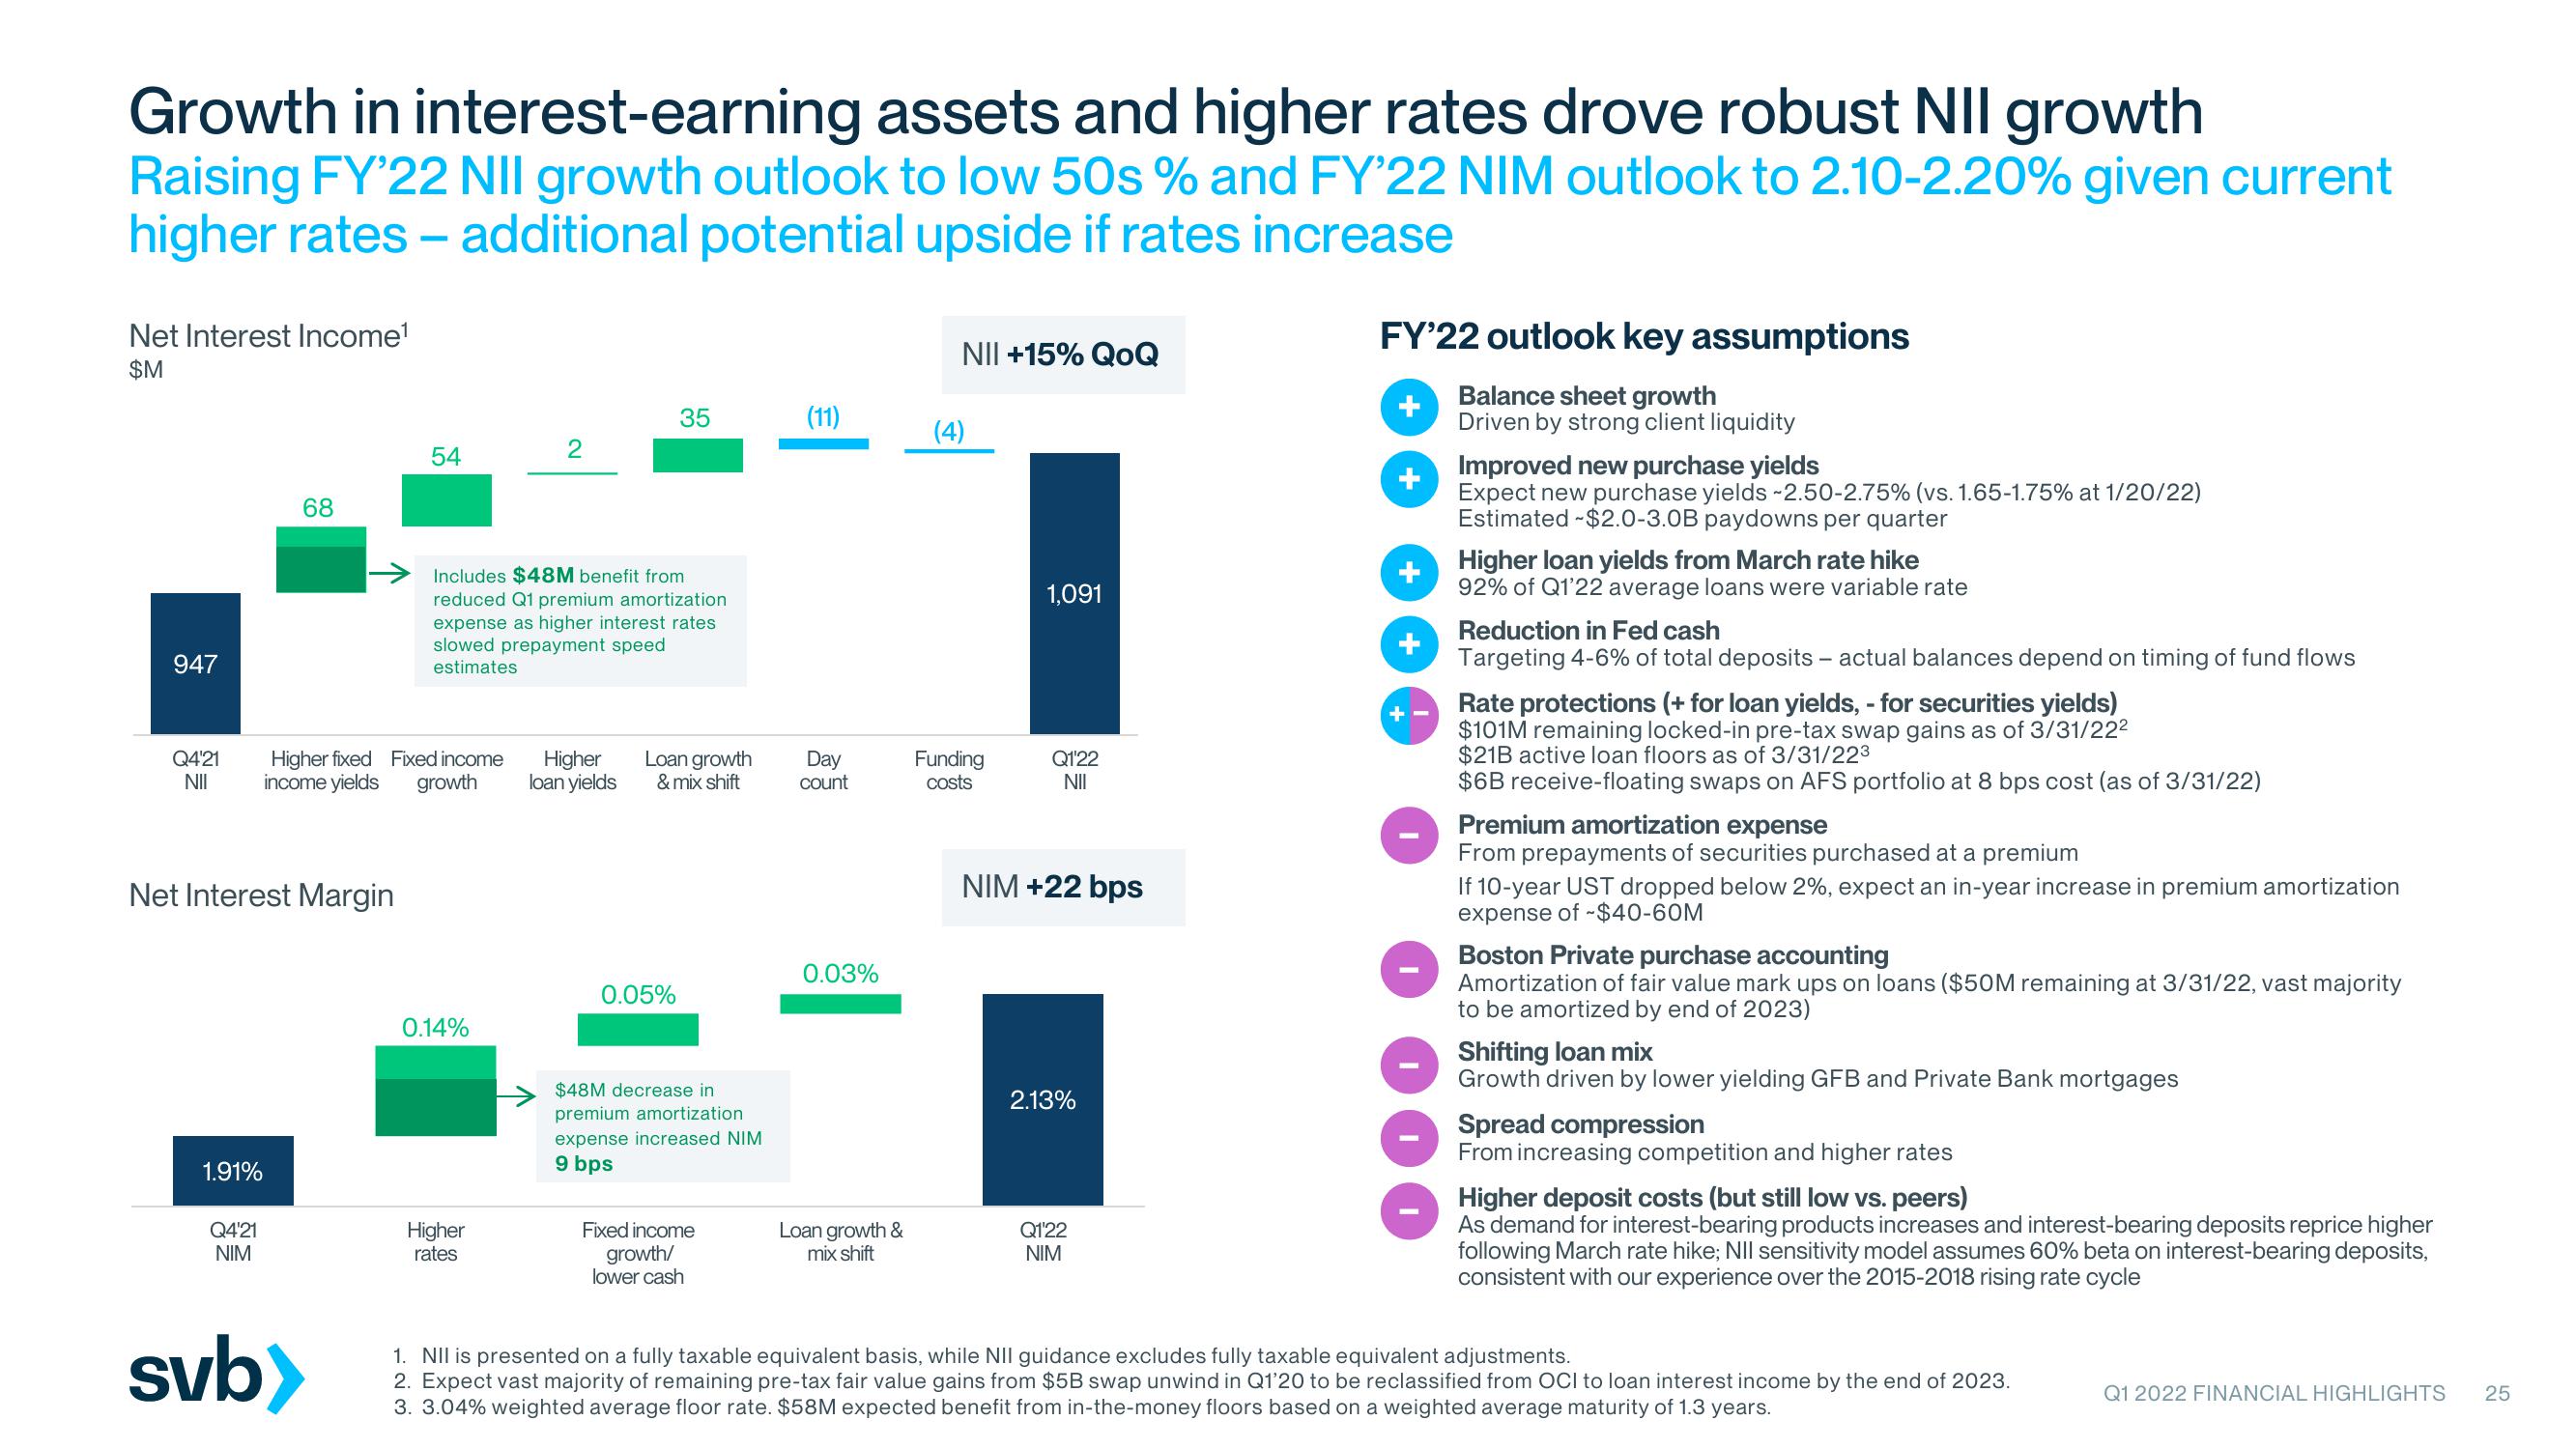
Growth in interest-earning assets and higher rates drove robust NII growth
Raising FY'22 NII growth outlook to low 50s % and FY'22 NIM outlook to 2.10-2.20% given current
higher rates - additional potential upside if rates increase
Net Interest Income¹
$M
947
Q4'21
NII
68
1.91%
Net Interest Margin
54
Higher fixed Fixed income
income yields growth
Q4'21
NIM
svb>
Includes $48M benefit from
reduced Q1 premium amortization
expense as higher interest rates
slowed prepayment speed
estimates
0.14%
2
Higher
rates
35
Higher Loan growth
loan yields
& mix shift
0.05%
$48M decrease in
premium amortization
expense increased NIM
9 bps
Fixed income
growth/
lower cash
(11)
Day
count
0.03%
Loan growth &
mix shift
NII +15% QOQ
(4)
Funding
costs
1,091
Q1'22
NII
NIM +22 bps
2.13%
Q1'22
NIM
FY'22 outlook key assumptions
Balance sheet growth
Driven by strong client liquidity
+
+
-
Improved new purchase yields
Expect new purchase yields -2.50-2.75% (vs. 1.65-1.75% at 1/20/22)
Estimated $2.0-3.0B paydowns per quarter
Higher loan yields from March rate hike
92% of Q1'22 average loans were variable rate
Reduction in Fed cash
Targeting 4-6% of total deposits - actual balances depend on timing of fund flows
Rate protections (+ for loan yields, - for securities yields)
$101M remaining locked-in pre-tax swap gains as of 3/31/22²
$21B active loan floors as of 3/31/223
$6B receive-floating swaps on AFS portfolio at 8 bps cost (as of 3/31/22)
Premium amortization expense
From prepayments of securities purchased at a premium
If 10-year UST dropped below 2%, expect an in-year increase in premium amortization
expense of -$40-60M
Boston Private purchase accounting
Amortization of fair value mark ups on loans ($50M remaining at 3/31/22, vast majority
to be amortized by end of 2023)
Shifting loan mix
Growth driven by lower yielding GFB and Private Bank mortgages
Spread compression
From increasing competition and higher rates
Higher deposit costs (but still low vs. peers)
As demand for interest-bearing products increases and interest-bearing deposits reprice higher
following March rate hike; NII sensitivity model assumes 60% beta on interest-bearing deposits,
consistent with our experience over the 2015-2018 rising rate cycle
1. NII is presented on a fully taxable equivalent basis, while NII guidance excludes fully taxable equivalent adjustments.
2. Expect vast majority of remaining pre-tax fair value gains from $5B swap unwind in Q1'20 to be reclassified from OCI to loan interest income by the end of 2023.
3. 3.04% weighted average floor rate. $58M expected benefit from in-the-money floors based on a weighted average maturity of 1.3 years.
Q1 2022 FINANCIAL HIGHLIGHTS 25View entire presentation