Wix Investor Presentation Deck
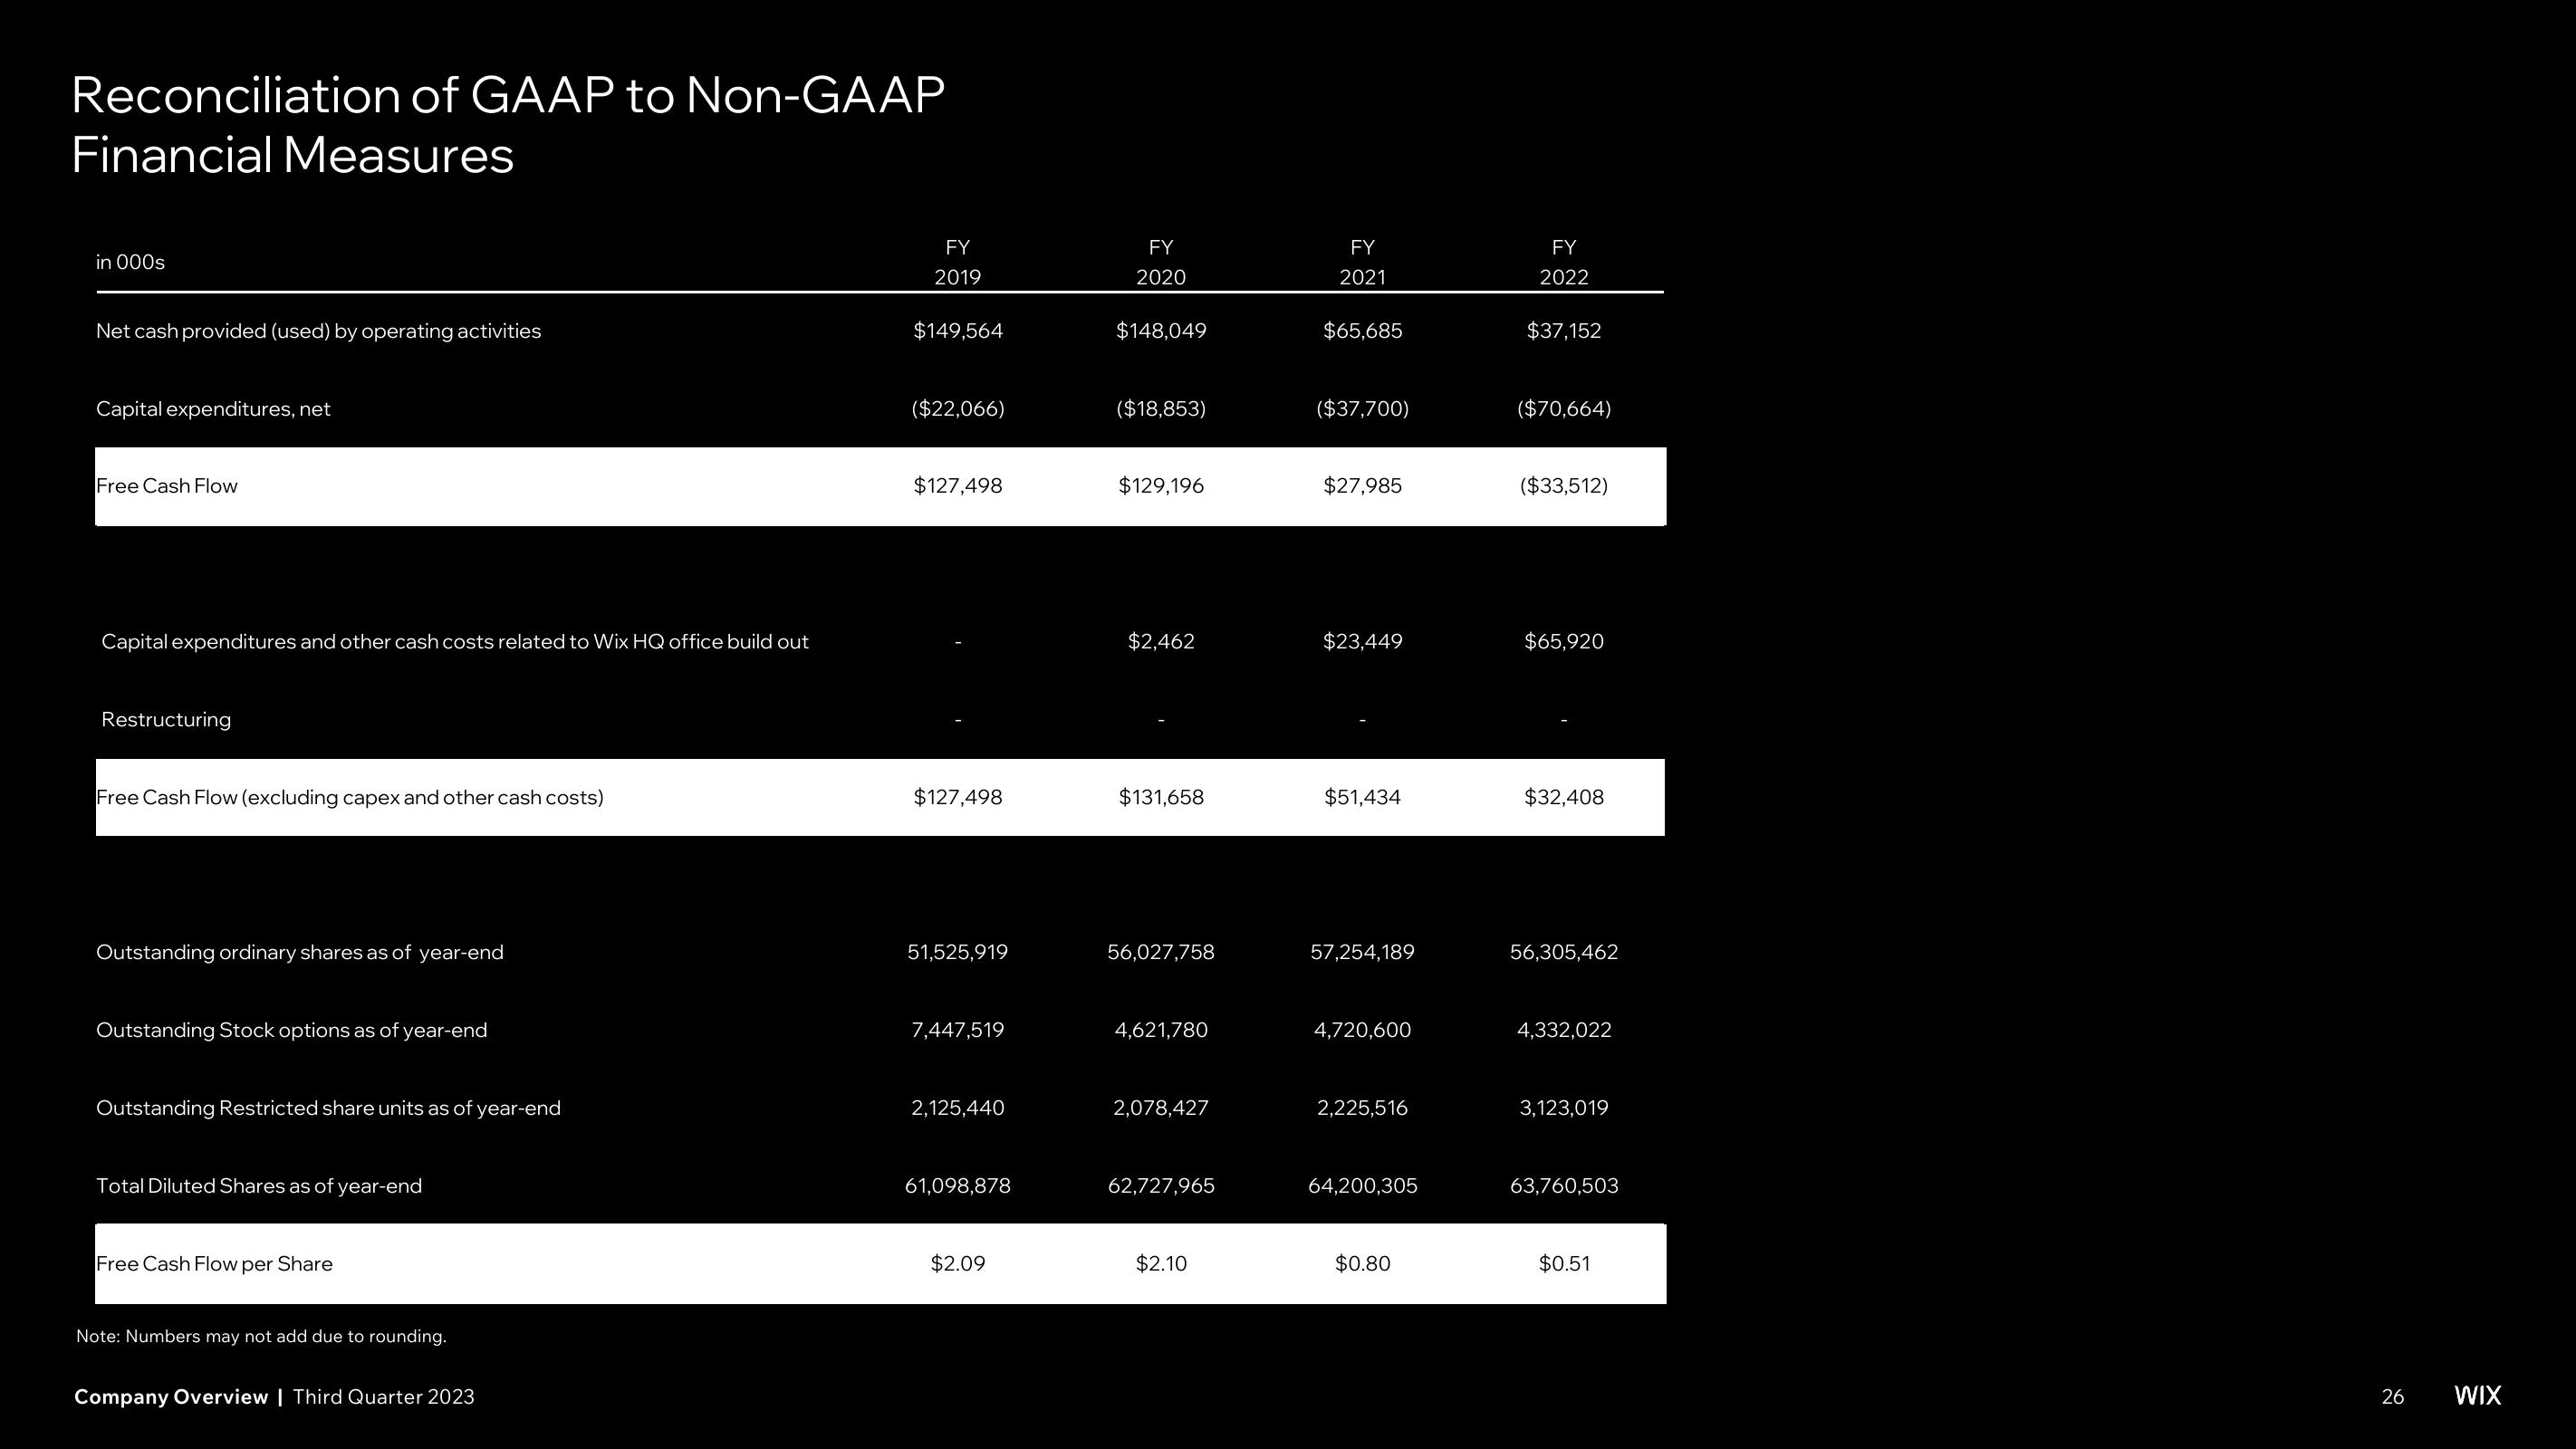
Reconciliation of GAAP to Non-GAAP
Financial Measures
in 000s
Net cash provided (used) by operating activities
Capital expenditures, net
Free Cash Flow
Capital expenditures and other cash costs related to Wix HQ office build out
Restructuring
Free Cash Flow (excluding capex and other cash costs)
Outstanding ordinary shares as of year-end
Outstanding Stock options as of year-end
Outstanding Restricted share units as of year-end
Total Diluted Shares as of year-end
Free Cash Flow per Share
Note: Numbers may not add due to rounding.
Company Overview | Third Quarter 2023
FY
2019
$149,564
($22,066)
$127,498
$127,498
51,525,919
7,447,519
2,125,440
61,098,878
$2.09
FY
2020
$148,049
($18,853)
$129,196
$2,462
$131,658
56,027,758
4,621,780
2,078,427
62,727,965
$2.10
FY
2021
$65,685
($37,700)
$27,985
$23,449
$51,434
57,254,189
4,720,600
2,225,516
64,200,305
$0.80
FY
2022
$37,152
($70,664)
($33,512)
$65,920
$32,408
56,305,462
4,332,022
3,123,019
63,760,503
$0.51
26
WIXView entire presentation