Silicon Valley Bank Results Presentation Deck
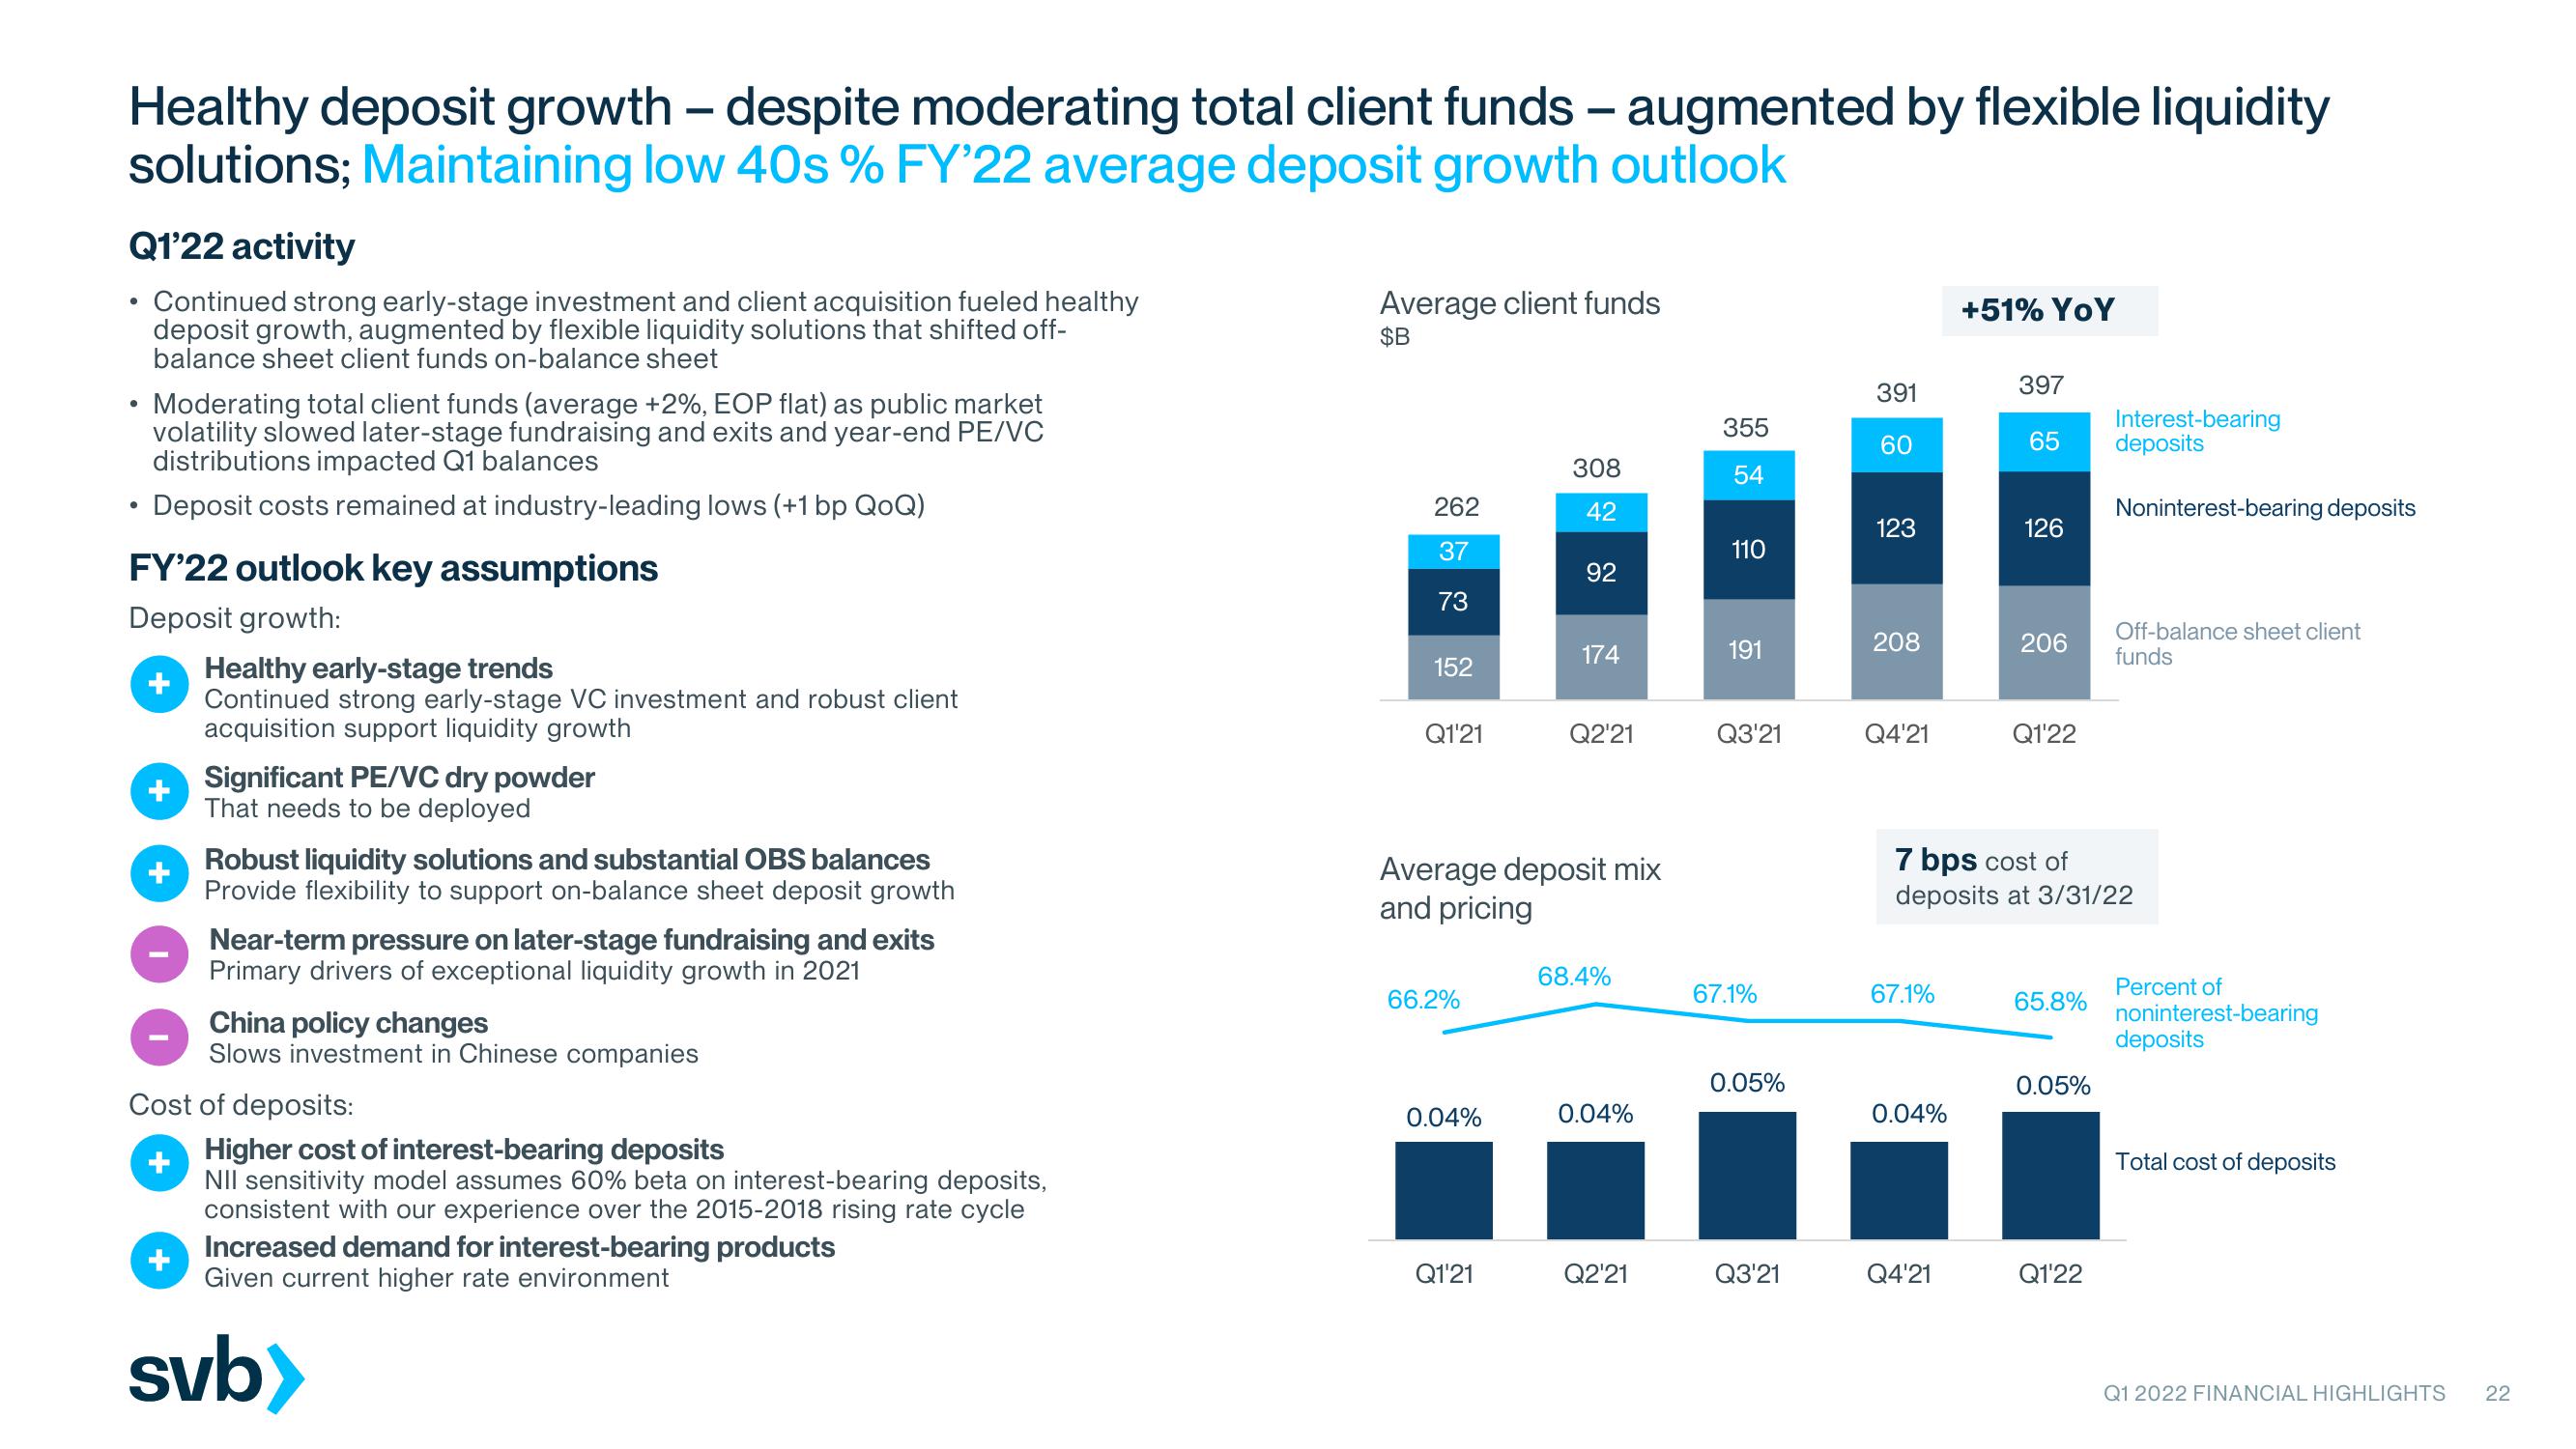
Healthy deposit growth - despite moderating total client funds - augmented by flexible liquidity
solutions; Maintaining low 40s % FY'22 average deposit growth outlook
Q1'22 activity
Continued strong early-stage investment and client acquisition fueled healthy
deposit growth, augmented by flexible liquidity solutions that shifted off-
balance sheet client funds on-balance sheet
• Moderating total client funds (average +2%, EOP flat) as public market
volatility slowed later-stage fundraising and exits and year-end PE/VC
distributions impacted Q1 balances
Deposit costs remained at industry-leading lows (+1 bp QoQ)
●
FY'22 outlook key assumptions
Deposit growth:
+
Healthy early-stage trends
Continued strong early-stage VC investment and robust client
acquisition support liquidity growth
Significant PE/VC dry powder
That needs to be deployed
Robust liquidity solutions and substantial OBS balances
Provide flexibility to support on-balance sheet deposit growth
Near-term pressure on later-stage fundraising and exits
Primary drivers of exceptional liquidity growth in 2021
China policy changes
Slows investment in Chinese companies
Cost of deposits:
+
Higher cost of interest-bearing deposits
NII sensitivity model assumes 60% beta on interest-bearing deposits,
consistent with our experience over the 2015-2018 rising rate cycle
Increased demand for interest-bearing products
Given current higher rate environment
svb>
Average client funds
$B
262
37
73
152
Q1'21
66.2%
0.04%
308
42
Q1'21
92
Average deposit mix
and pricing
174
Q2¹21
68.4%
0.04%
Q2'21
355
54
110
191
Q3'21
67.1%
0.05%
Q3'21
391
60
123
208
Q4'21
67.1%
0.04%
+51% YoY
Q4'21
397
65
126
206
Q1'22
7 bps cost of
deposits at 3/31/22
65.8%
0.05%
Interest-bearing
deposits
Q1'22
Noninterest-bearing deposits
Off-balance sheet client
funds
Percent of
noninterest-bearing
deposits
Total cost of deposits
Q1 2022 FINANCIAL HIGHLIGHTS
22View entire presentation