Silicon Valley Bank Results Presentation Deck
Tech & LS/HC
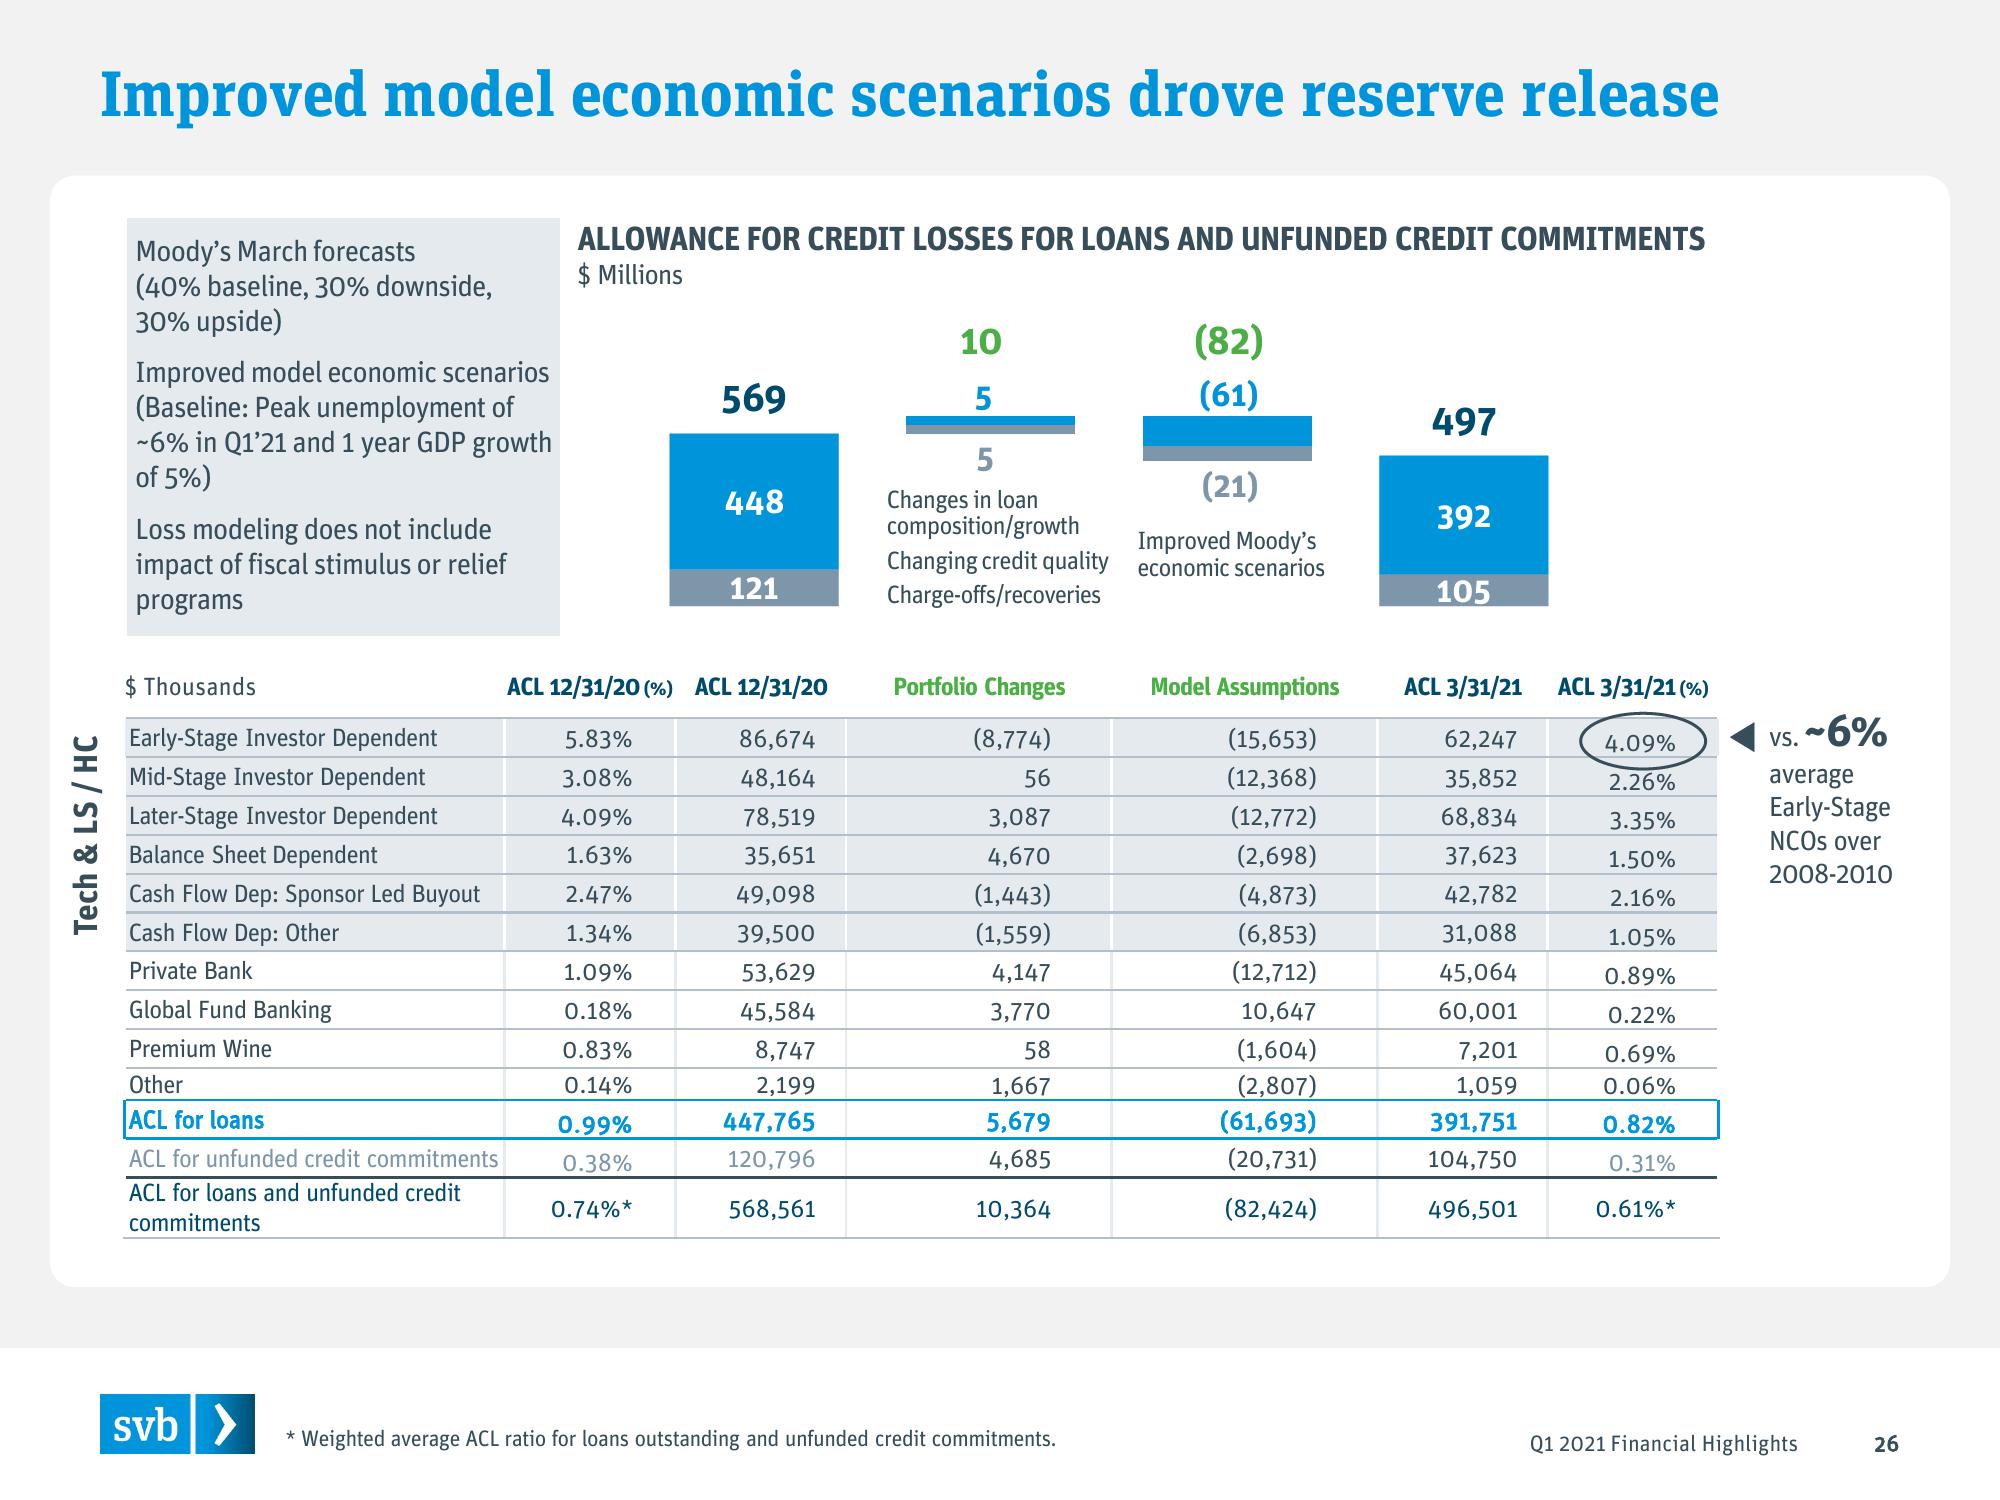
Improved model economic scenarios drove reserve release
ALLOWANCE FOR CREDIT LOSSES FOR LOANS AND UNFUNDED CREDIT COMMITMENTS
$ Millions
Moody's March forecasts
(40% baseline, 30% downside,
30% upside)
Improved model economic scenarios
(Baseline: Peak unemployment of
-6% in Q1'21 and 1 year GDP growth
of 5%)
Loss modeling does not include
impact of fiscal stimulus or relief
programs
$ Thousands
Early-Stage Investor Dependent
Mid-Stage Investor Dependent
Later-Stage Investor Dependent
Balance Sheet Dependent
Cash Flow Dep: Sponsor Led Buyout
Cash Flow Dep: Other
Private Bank
Global Fund Banking
Premium Wine
Other
ACL for loans
ACL for unfunded credit commitments
ACL for loans and unfunded credit
commitments
svb>
569
0.99%
0.38%
0.74%*
448
121
ACL 12/31/20 (%) ACL 12/31/20
5.83%
86,674
3.08%
48,164
4.09%
1.63%
2.47%
1.34%
1.09%
0.18%
0.83%
0.14%
78,519
35,651
49,098
39,500
53,629
45,584
8,747
2,199
447,765
120,796
568,561
10
5
5
Changes in loan
composition/growth
Changing credit quality
Charge-offs/recoveries
Portfolio Changes
(8,774)
56
3,087
4,670
(1,443)
(1,559)
4,147
3,770
58
1,667
5,679
4,685
10,364
* Weighted average ACL ratio for loans outstanding and unfunded credit commitments.
(82)
(61)
(21)
Improved Moody's
economic scenarios
Model Assumptions
(15,653)
(12,368)
(12,772)
(2,698)
(4,873)
(6,853)
(12,712)
10,647
(1,604)
(2,807)
(61,693)
(20,731)
(82,424)
497
392
105
ACL 3/31/21 ACL 3/31/21 (%)
62,247
35,852
68,834
37,623
42,782
31,088
45,064
60,001
7,201
1,059
391,751
104,750
496,501
4.09%
2.26%
3.35%
1.50%
2.16%
1.05%
0.89%
0.22%
0.69%
0.06%
0.82%
0.31%
0.61%*
Vs. ~6%
average
Early-Stage
NCOS over
2008-2010
Q1 2021 Financial Highlights
26View entire presentation