Silicon Valley Bank Results Presentation Deck
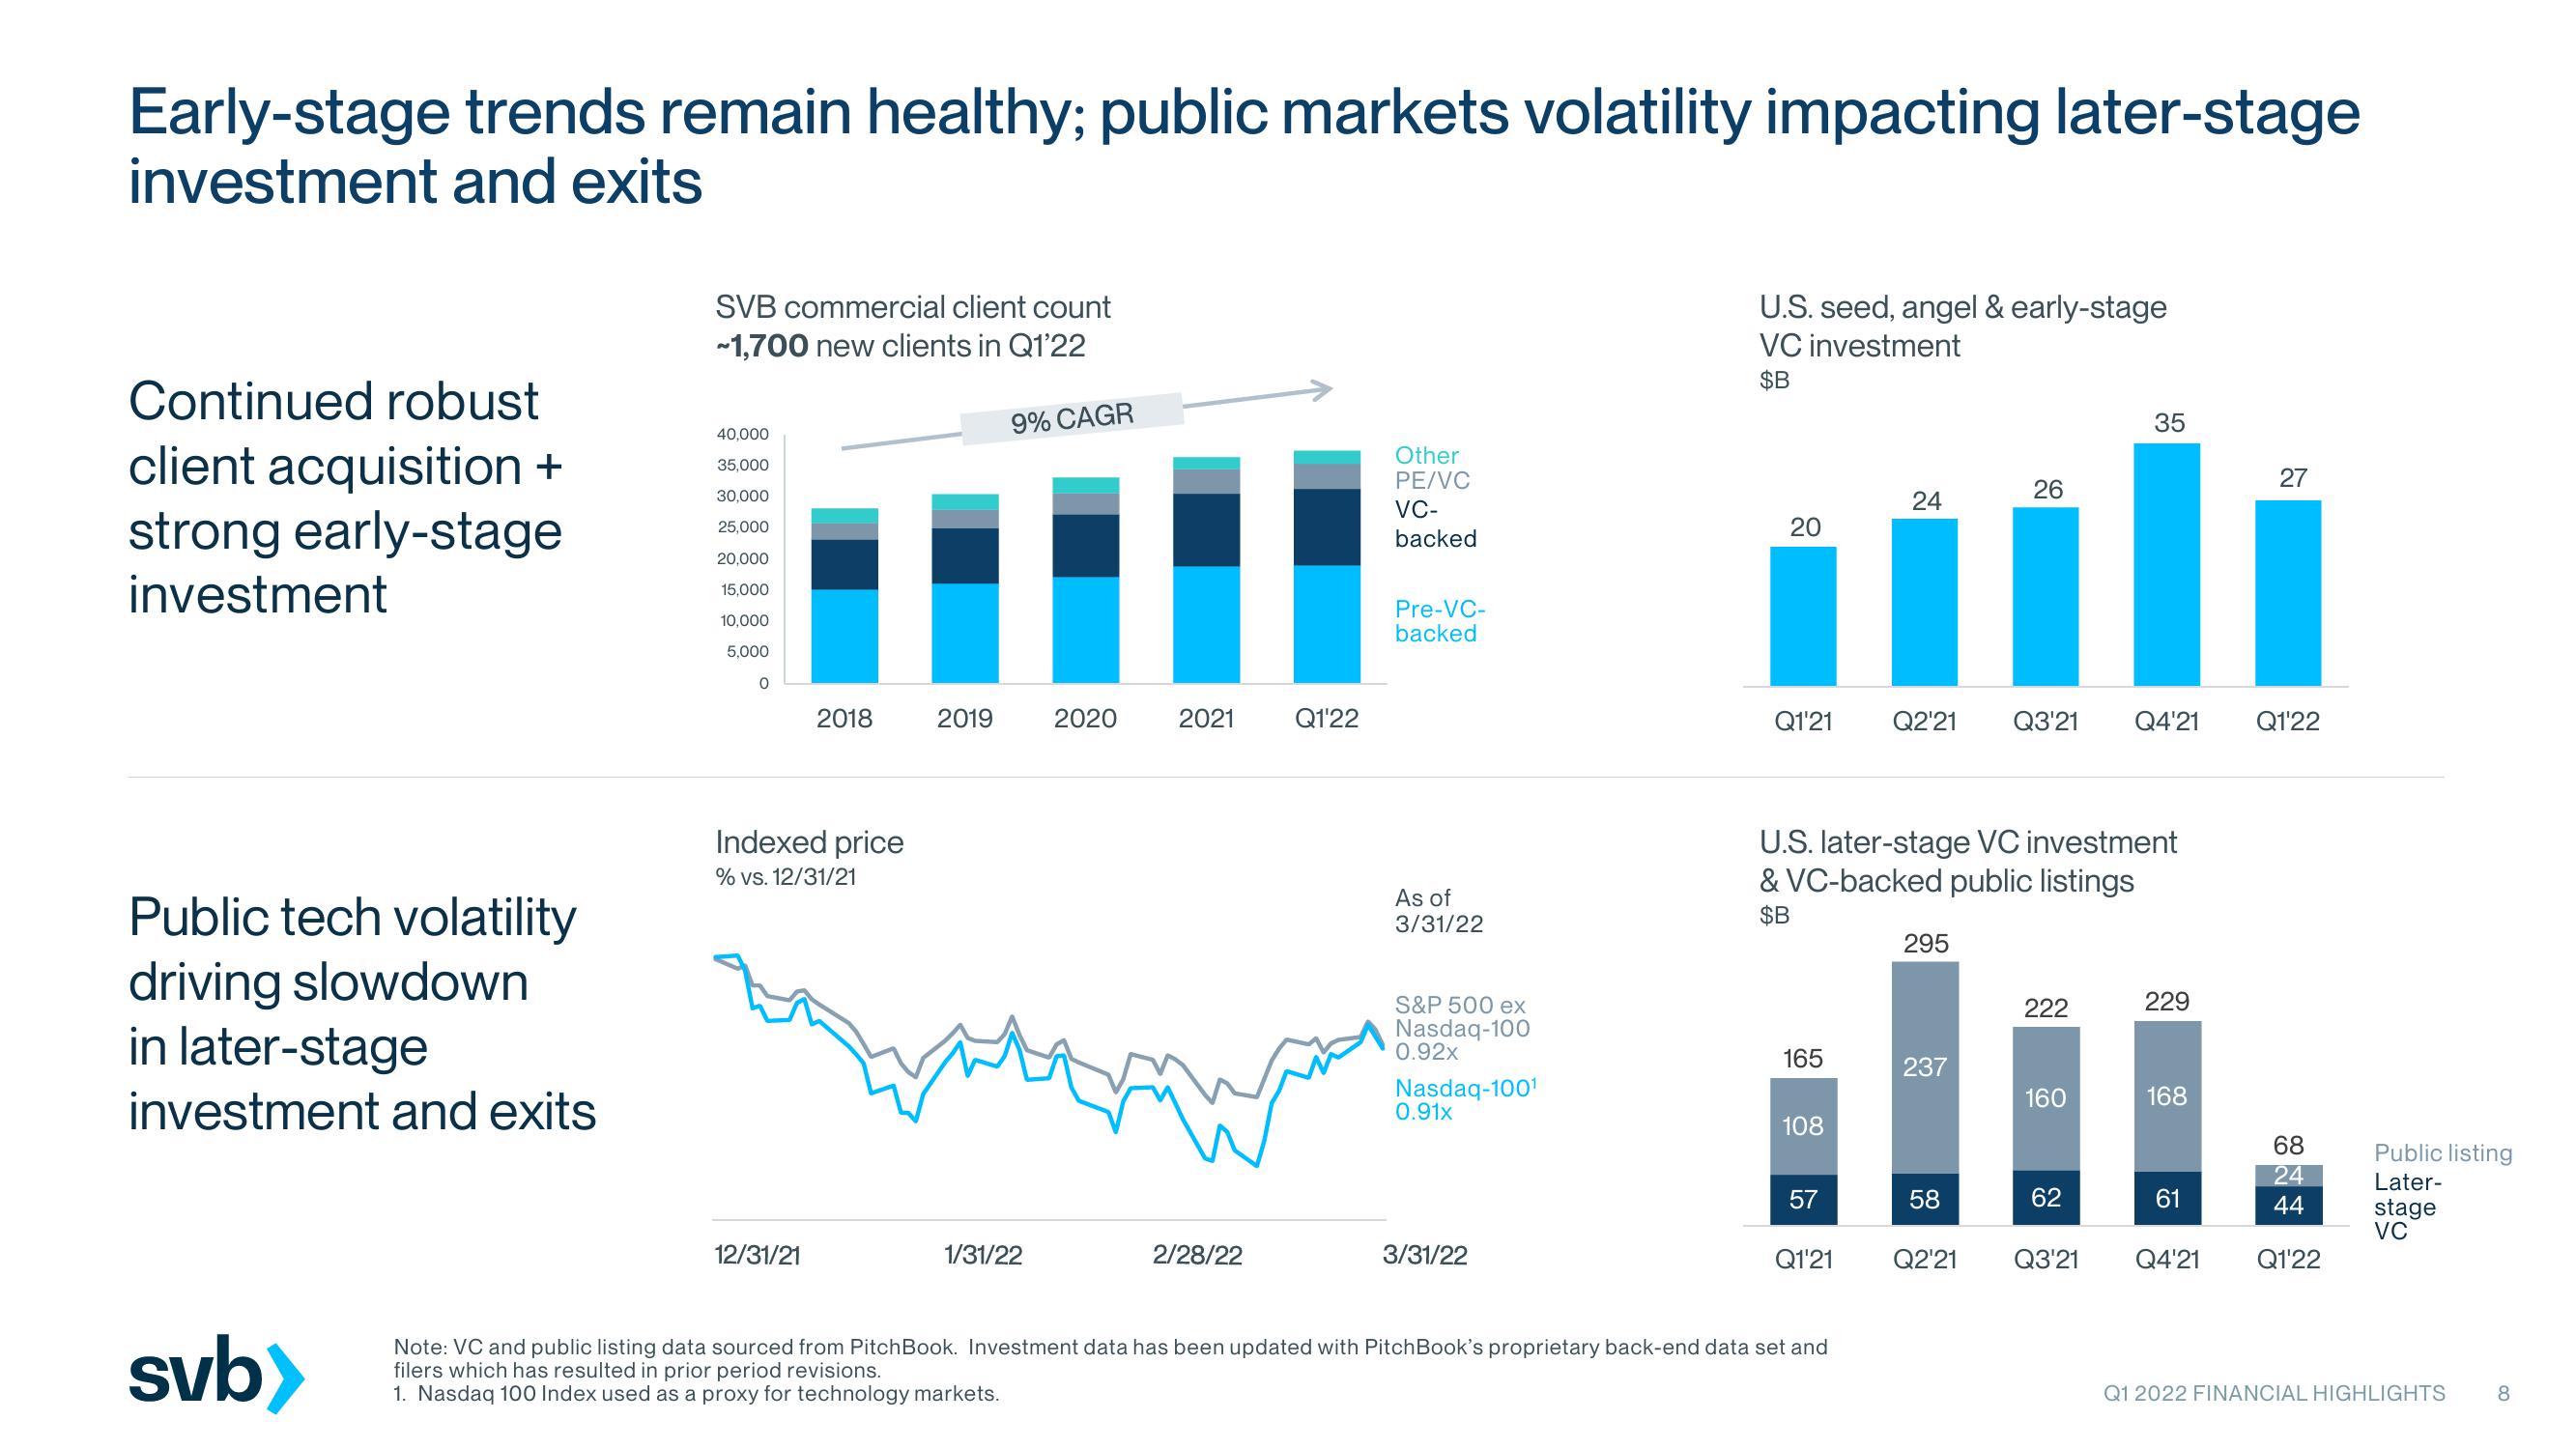
Early-stage trends remain healthy; public markets volatility impacting later-stage
investment and exits
Continued robust
client acquisition +
strong early-stage
investment
Public tech volatility
driving slowdown
in later-stage
investment and exits
svb>
SVB commercial client count
~1,700 new clients in Q1'22
40,000
35,000
30,000
25,000
20,000
15,000
10,000
5,000
0
2018
Indexed pri
% vs. 12/31/21
12/31/21
2019
9% CAGR
1/31/22
2020
2021
2/28/22
Q1'22
Other
PE/VC
VC-
backed
Pre-VC-
backed
As of
3/31/22
S&P 500 ex
Nasdaq-100
0.92x
Nasdaq-100¹
0.91x
3/31/22
U.S. seed, angel & early-stage
VC investment
$B
20
Q1'21
165
108
57
U.S. later-stage VC investment
& VC-backed public listings
$B
Q1'21
24
Note: VC and public listing data sourced from Pitch Book. Investment data has been updated with PitchBook's proprietary back-end data set and
filers which has resulted in prior period revisions.
1. Nasdaq 100 Index used as a proxy for technology markets.
Q2'21 Q3'21 Q4'21
295
237
26
58
Q2'21
222
160
35
62
Q3'21
229
168
27
61
Q1'22
68
24
44
Q4'21 Q1'22
Public listing
Later-
stage
VC
Q1 2022 FINANCIAL HIGHLIGHTS
8View entire presentation