Silicon Valley Bank Results Presentation Deck
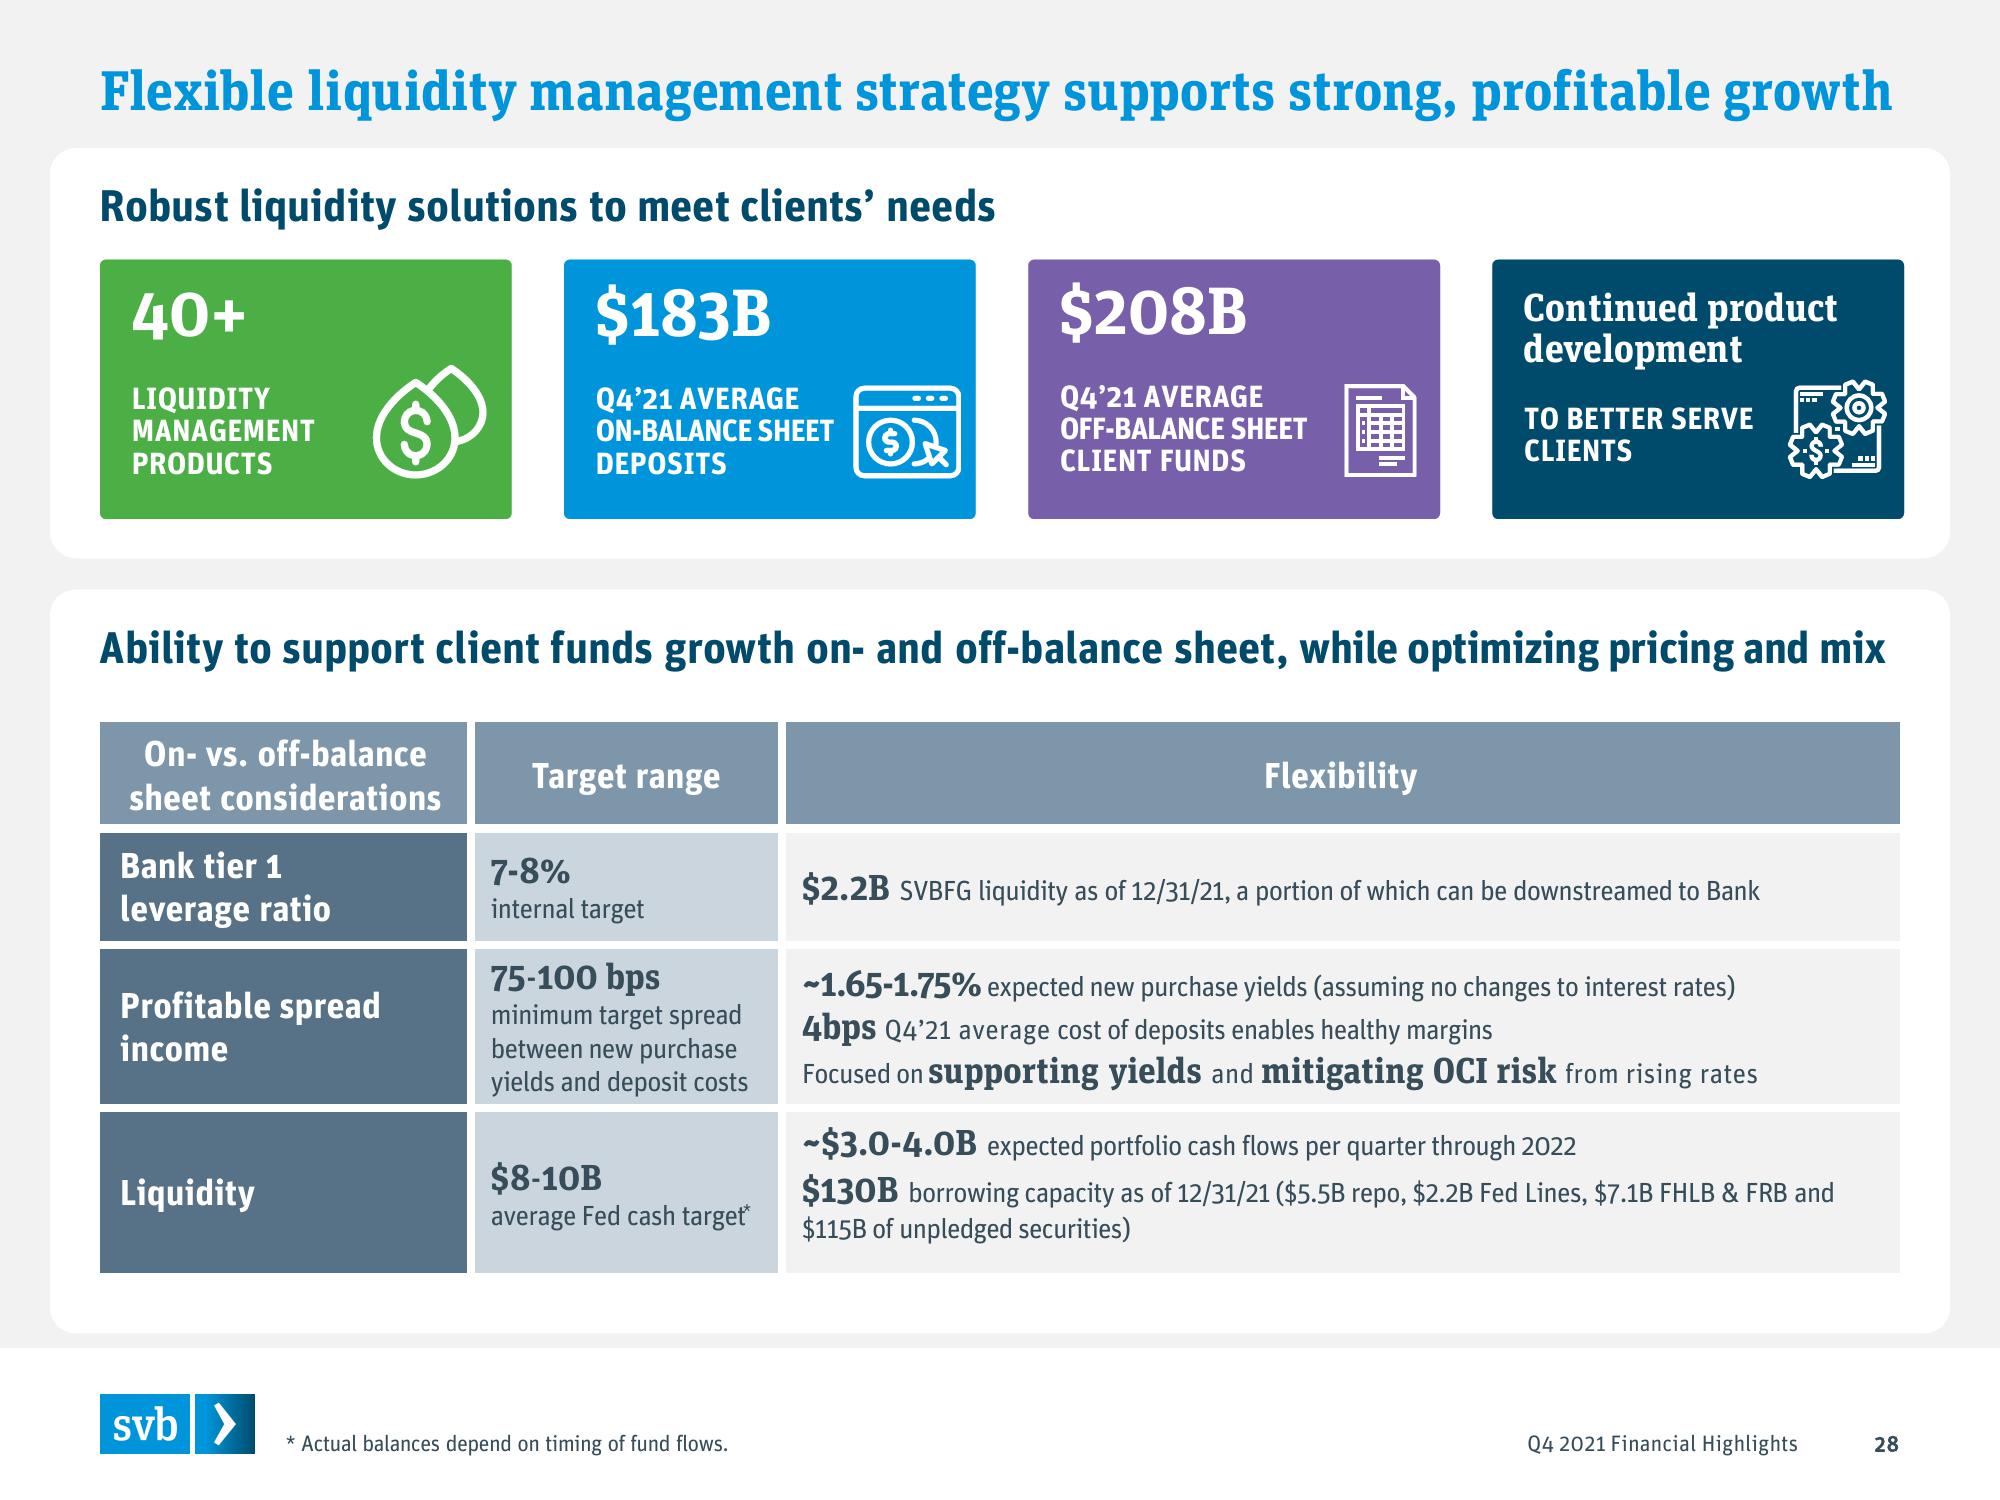
Flexible liquidity management strategy supports strong, profitable growth
Robust liquidity solutions to meet clients' needs
$183B
Q4'21 AVERAGE
ON-BALANCE SHEET
DEPOSITS
40+
LIQUIDITY
MANAGEMENT
PRODUCTS
On- vs. off-balance
sheet considerations
Bank tier 1
leverage ratio
Profitable spread
income
Ability to support client funds growth on- and off-balance sheet, while optimizing pricing and mix
Liquidity
svb >
Target range
7-8%
internal target
75-100 bps
minimum target spread
between new purchase
yields and deposit costs
$8-10B
average Fed cash target*
3
* Actual balances depend on timing of fund flows.
$208B
Q4'21 AVERAGE
OFF-BALANCE SHEET
CLIENT FUNDS
Continued product
development
Flexibility
TO BETTER SERVE
CLIENTS
$2.2B SVBFG liquidity as of 12/31/21, a portion of which can be downstreamed to Bank
-1.65-1.75% expected new purchase yields (assuming no changes to interest rates)
4bps Q4'21 average cost of deposits enables healthy margins
Focused on supporting yields and mitigating OCI risk from rising rates
-$3.0-4.0B expected portfolio cash flows per quarter through 2022
$130B borrowing capacity as of 12/31/21 ($5.5B repo, $2.2B Fed Lines, $7.1B FHLB & FRB and
$115B of unpledged securities)
Q4 2021 Financial Highlights
28View entire presentation