Silicon Valley Bank Results Presentation Deck
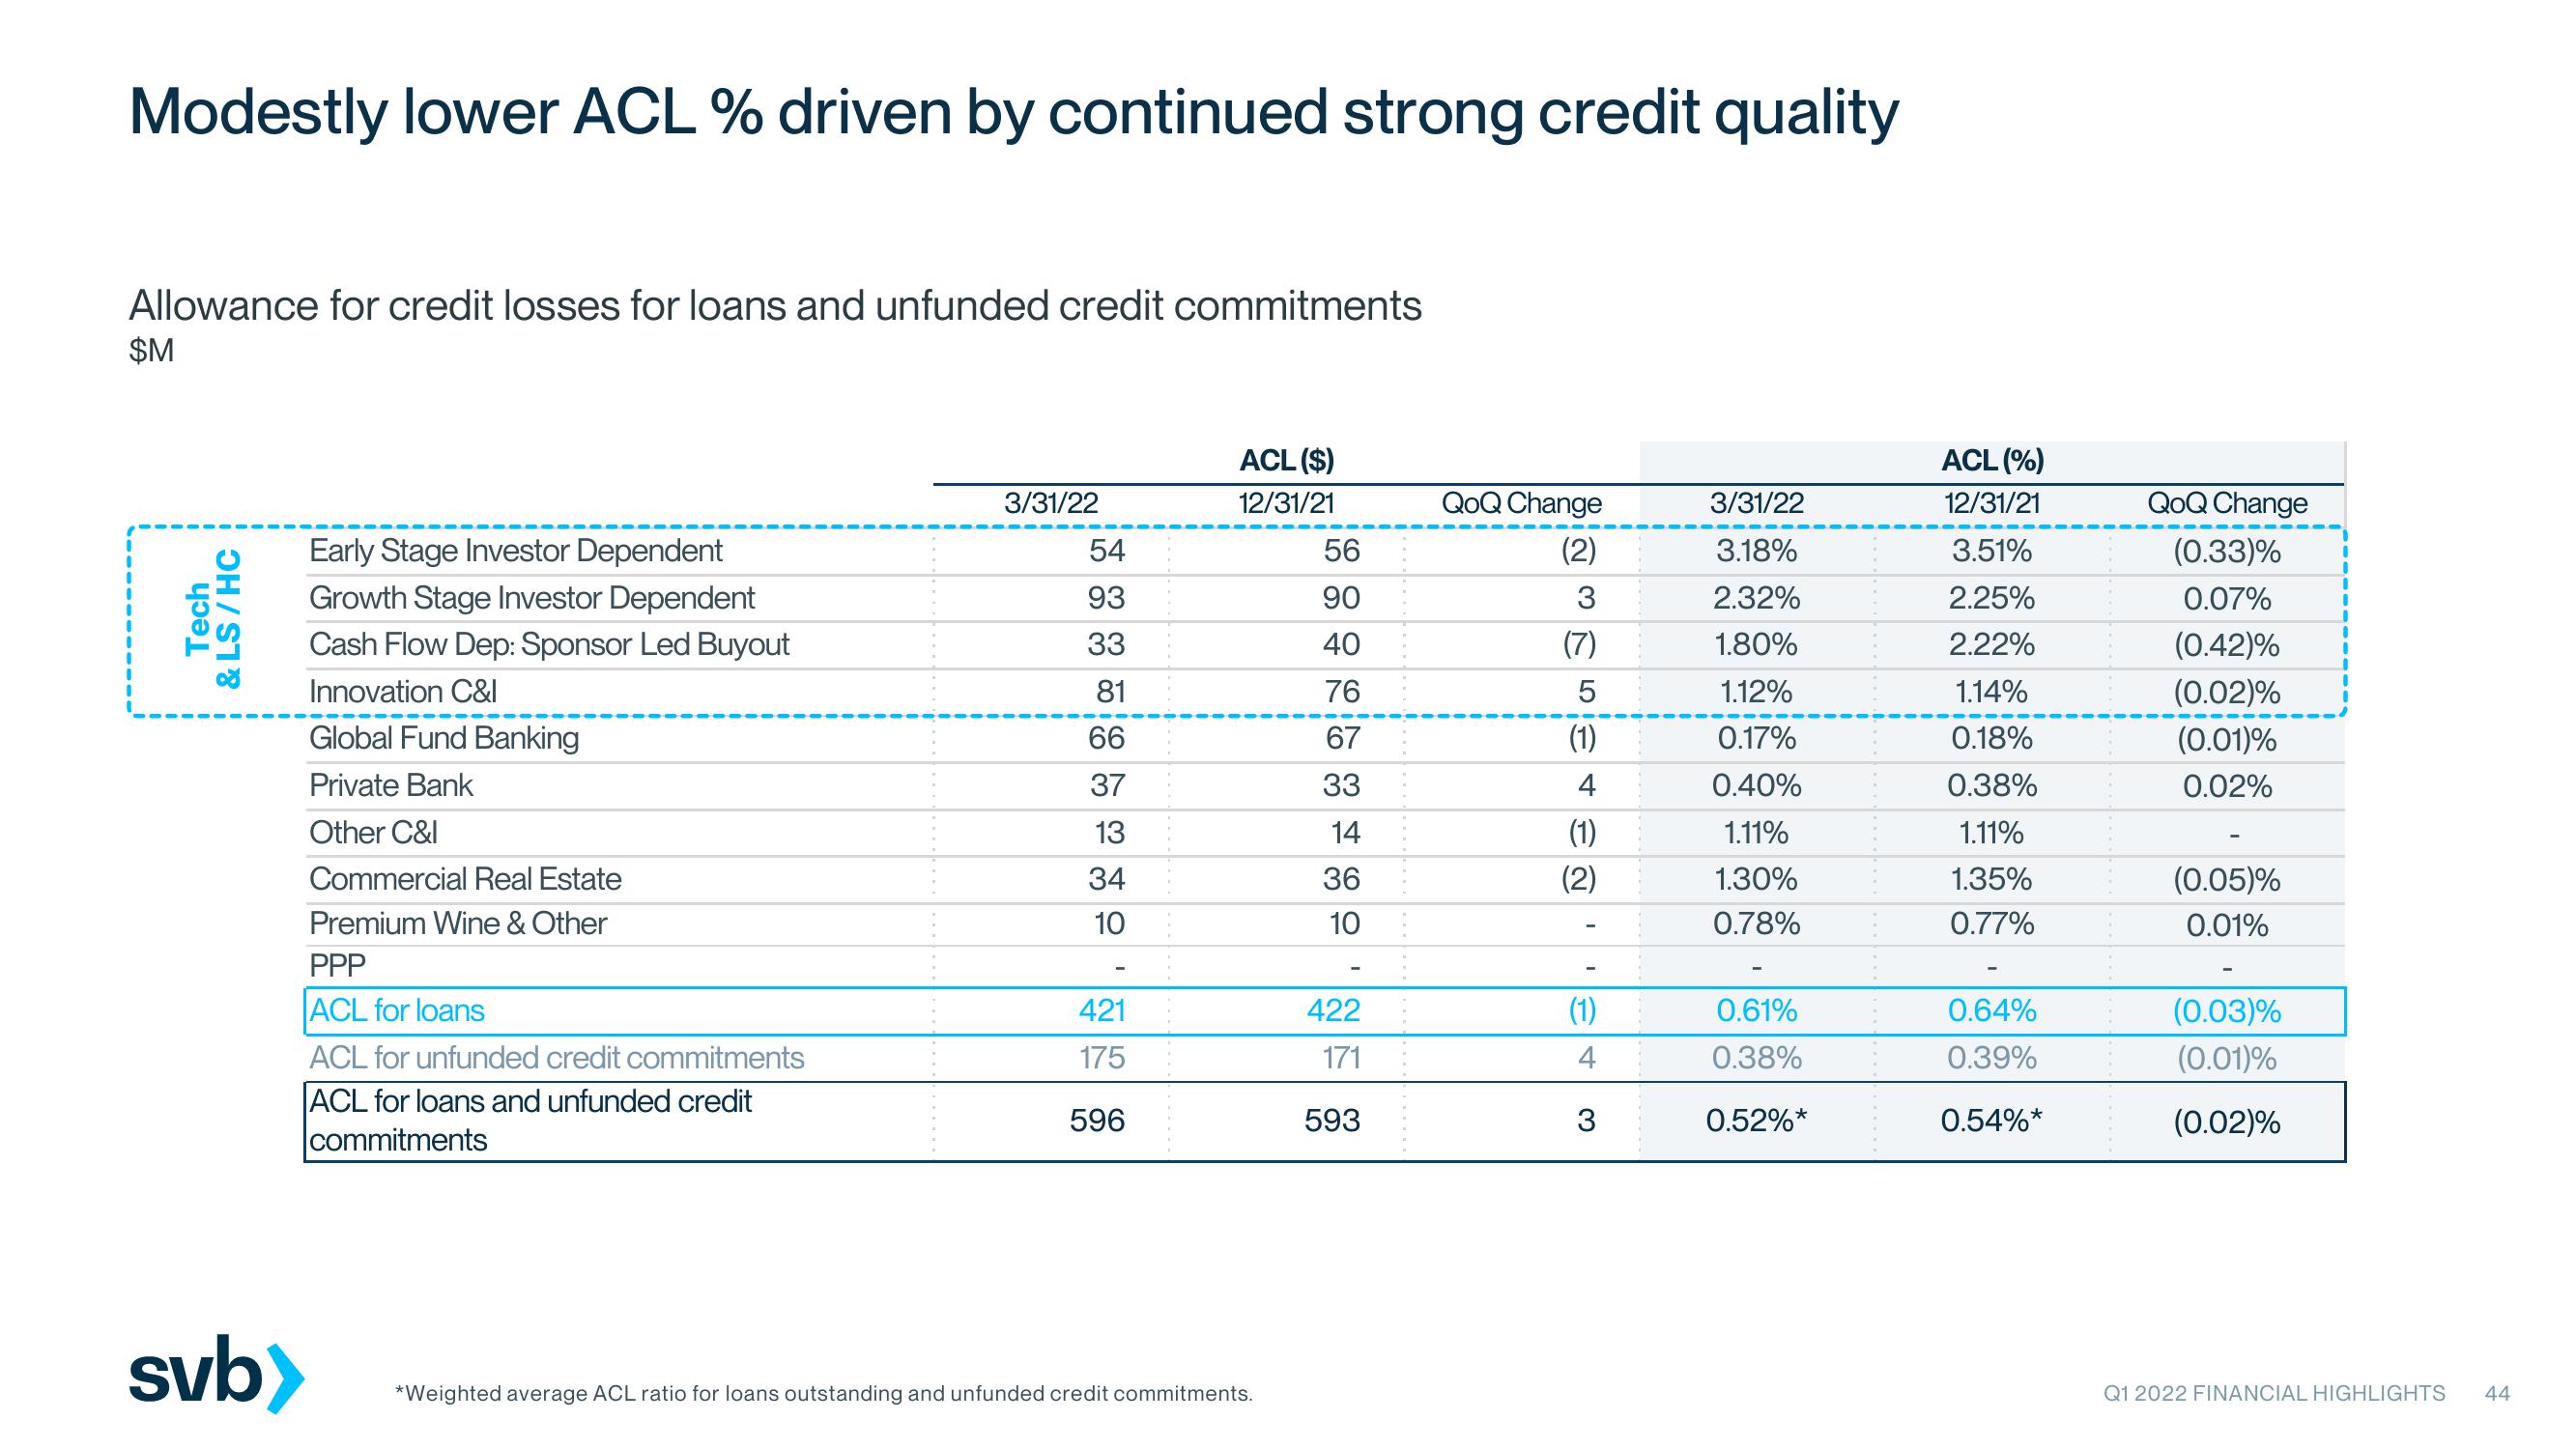
Modestly lower ACL % driven by continued strong credit quality
Allowance for credit losses for loans and unfunded credit commitments
$M
Tech
& LS/HC
svb>
Early Stage Investor Dependent
Growth Stage Investor Dependent
Cash Flow Dep: Sponsor Led Buyout
C&I
Innovation
Global Fund Banking
Private Bank
Other C&I
Commercial Real Estate
Premium Wine & Other
PPP
ACL for loans
ACL for unfunded credit commitments
ACL for loans and unfunded credit
commitments
3/31/22
54
93
33
81
66
37
13
34
10
421
175
596
ACL ($)
12/31/21
*Weighted average ACL ratio for loans outstanding and unfunded credit commitments.
56
90
40
76
67
33
14
36
10
422
171
593
QoQ Change
(2)
3
(7)
5
(1)
4
(1)
(2)
(1)
4
3
3/31/22
3.18%
2.32%
1.80%
1.12%
0.17%
0.40%
1.11%
1.30%
0.78%
0.61%
0.38%
0.52%*
ACL (%)
12/31/21
3.51%
2.25%
2.22%
1.14%
0.18%
0.38%
1.11%
1.35%
0.77%
0.64%
0.39%
0.54%*
QoQ Change
(0.33)%
0.07%
(0.42)%
(0.02)%
(0.01)%
0.02%
(0.05)%
0.01%
(0.03)%
(0.01)%
(0.02)%
Q1 2022 FINANCIAL HIGHLIGHTS
44View entire presentation