Silicon Valley Bank Results Presentation Deck
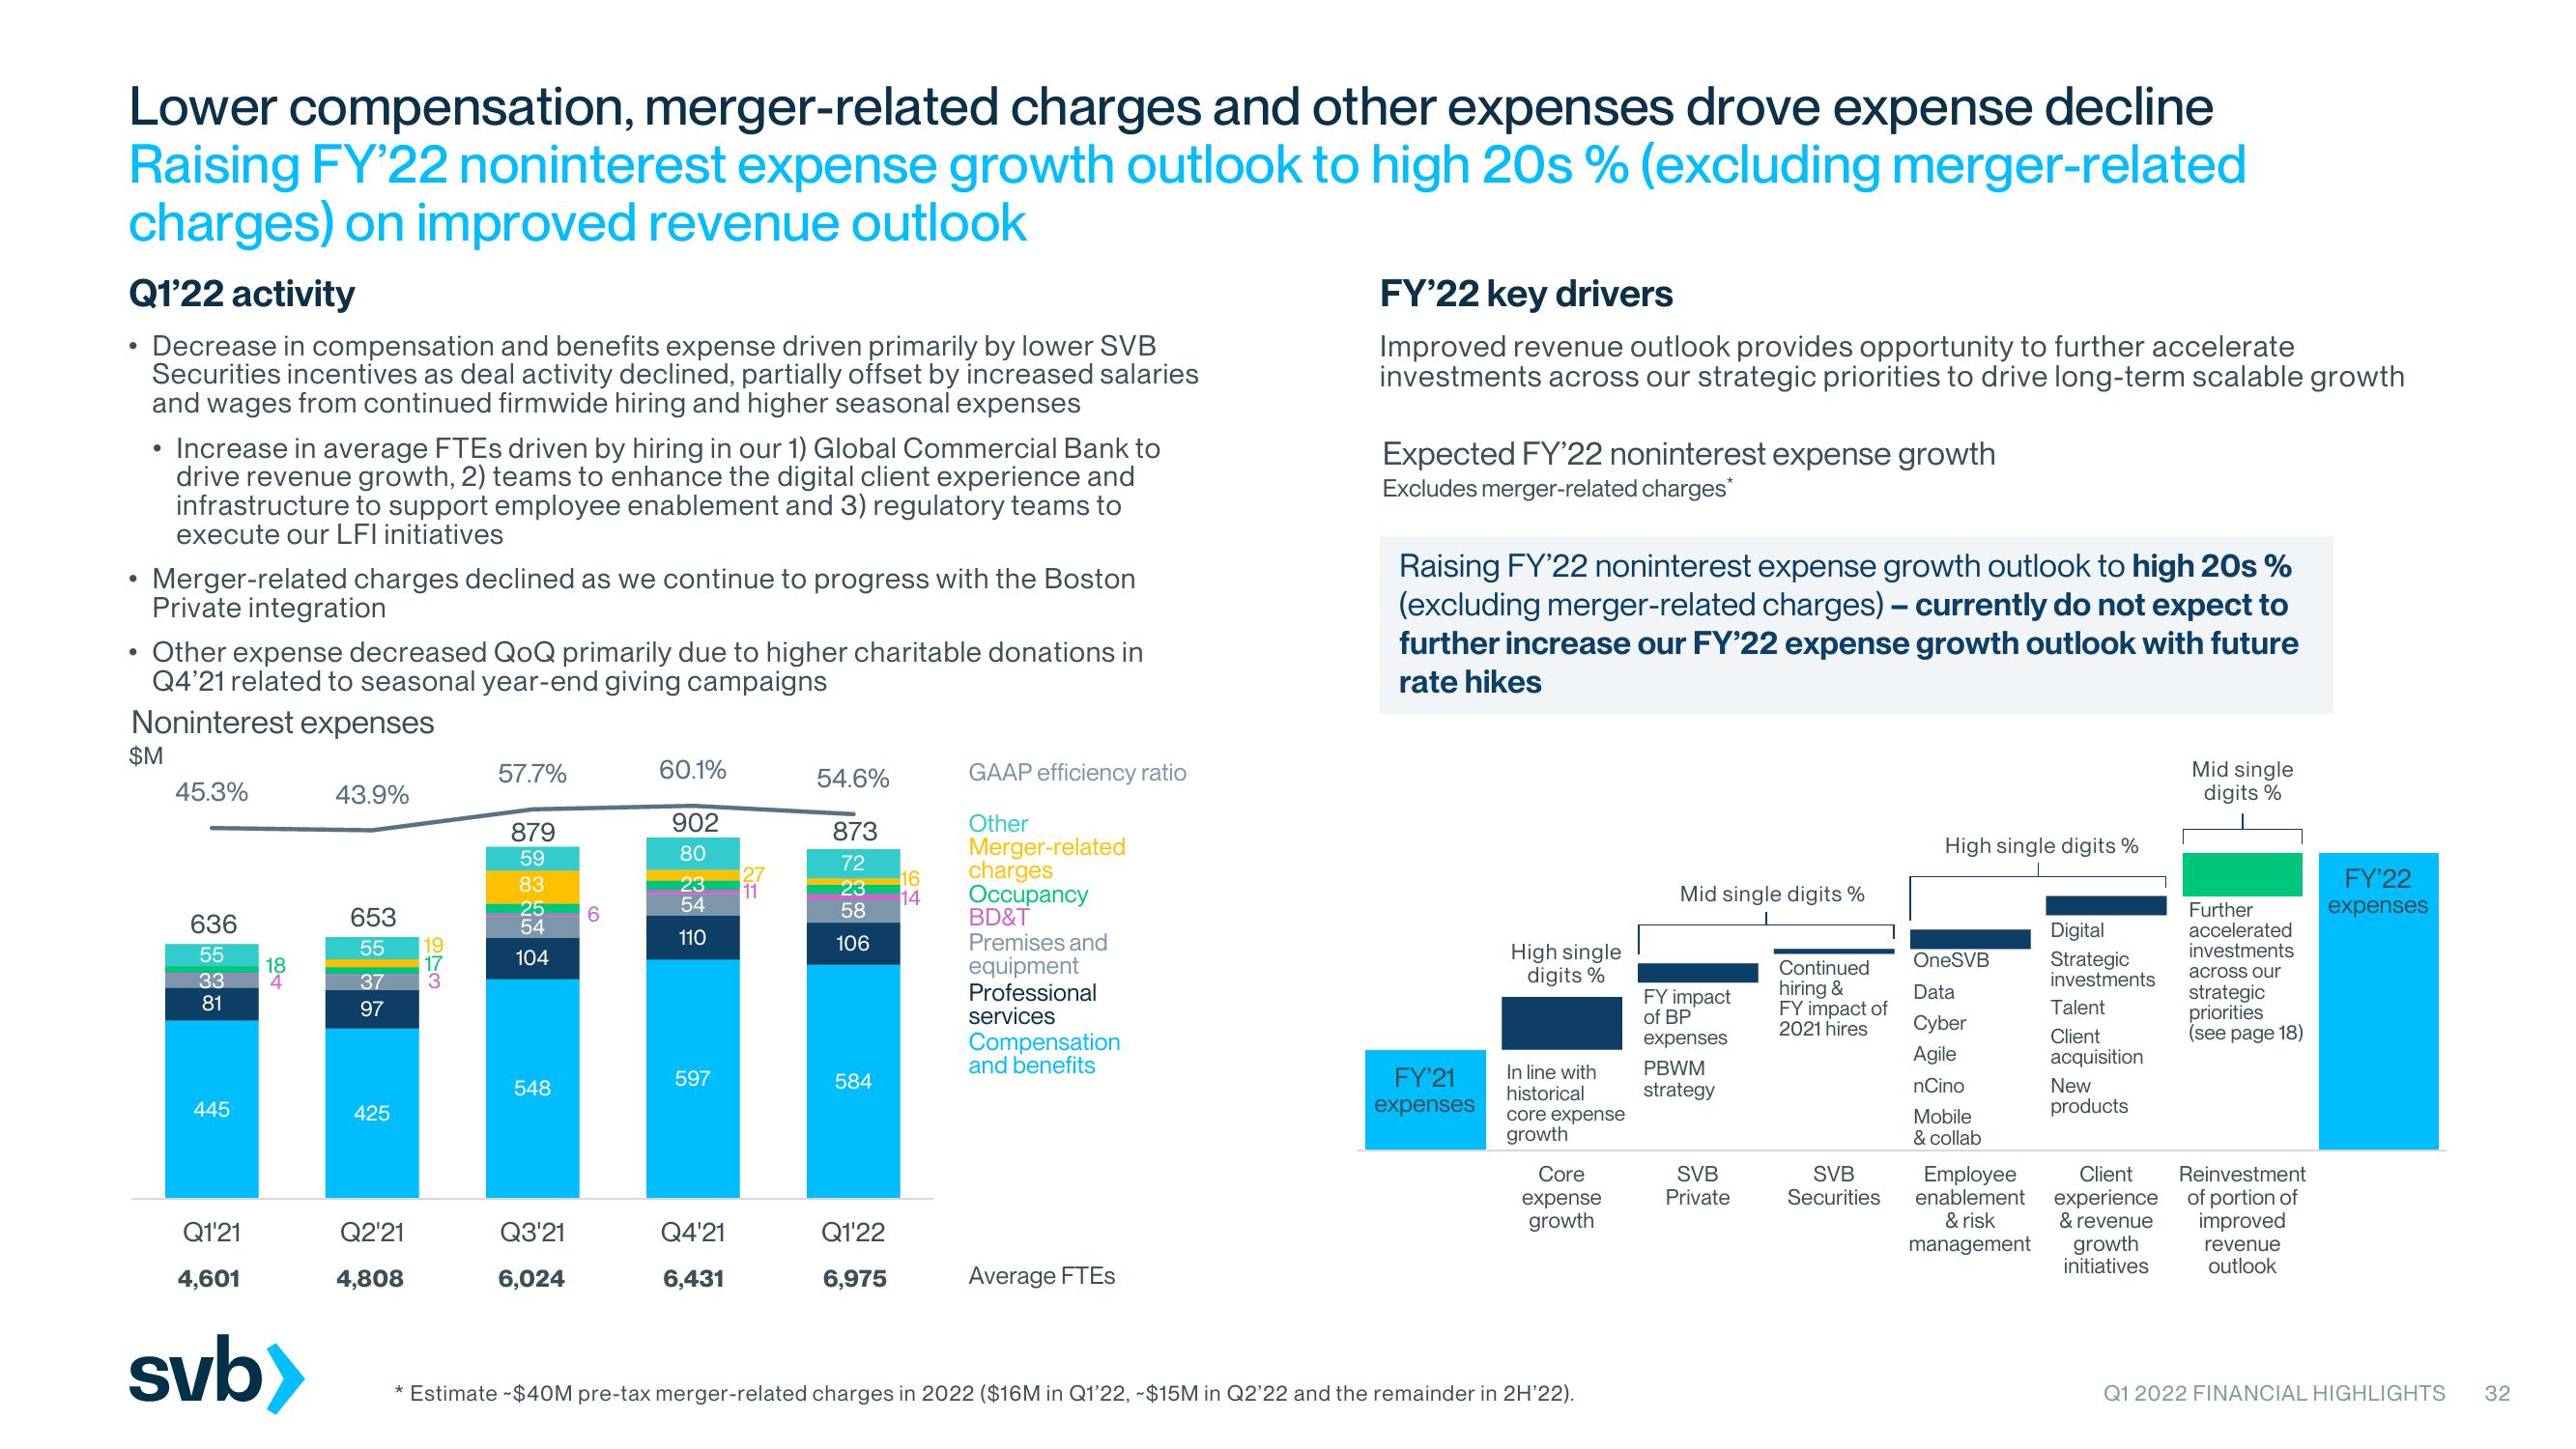
Lower compensation, merger-related charges and other expenses drove expense decline
Raising FY'22 noninterest expense growth outlook to high 20s % (excluding merger-related
charges) on improved revenue outlook
Q1'22 activity
Decrease in compensation and benefits expense driven primarily by lower SVB
Securities incentives as deal activity declined, partially offset by increased salaries
and wages from continued firmwide hiring and higher seasonal expenses
●
Increase in average FTES driven by hiring in our 1) Global Commercial Bank to
drive revenue growth, 2) teams to enhance the digital client experience and
infrastructure to support employee enablement and 3) regulatory teams to
execute our LFI initiatives
Merger-related charges declined as we continue to progress with the Boston
Private integration
Other expense decreased QoQ primarily due to higher charitable donations in
Q4'21 related to seasonal year-end giving campaigns
Noninterest expenses
●
●
●
$M
45.3%
636
55
33
81
445
Q1'21
4,601
18
4
svb>
43.9%
653
55
37
97
425
Q2'21
4,808
973
57.7%
879
59
83
25
54
104
548
Q3'21
6,024
6
60.1%
902
80
23
54
110
597
Q4'21
6,431
27
11
54.6%
873
72
23
58
106
584
Q1'22
6,975
16
64
14
GAAP efficiency ratio
Other
Merger-related
charges
Occupancy
BD&T
Premises and
equipment
Professional
services
Compensation
and benefits
Average FTES
FY'22 key drivers
Improved revenue outlook provides opportunity to further accelerate
investments across our strategic priorities to drive long-term scalable growth
Expected FY'22 noninterest expense growth
Excludes merger-related charges*
Raising FY'22 noninterest expense growth outlook to high 20s%
(excluding merger-related charges) - currently do not expect to
further increase our FY'22 expense growth outlook with future
rate hikes
FY'21
expenses
High single
digits %
In line with
historical
core expense
growth
Core
expense
growth
* Estimate - $40M pre-tax merger-related charges in 2022 ($16M in Q1'22, -$15M in Q2'22 and the remainder in 2H'22).
Mid single digits %
FY impact
of BP
expenses
PBWM
strategy
SVB
Private
Continued
hiring &
FY impact of
2021 hires
SVB
Securities
High single digits %
OneSVB
Data
Cyber
Agile
nCino
Mobile
& collab
Digital
Strategic
investments
Talent
Client
acquisition
New
products
Employee Client
enablement experience
& risk & revenue
management growth
initiatives
Mid single
digits %
Further
accelerated
investments
across our
strategic
priorities
(see page 18)
Reinvestment
of portion of
improved
revenue
outlook
FY'22
expenses
Q1 2022 FINANCIAL HIGHLIGHTS 32View entire presentation