Silicon Valley Bank Results Presentation Deck
Excellent credit performance - well-positioned to withstand potential impacts of prolonged public
market volatility; Maintaining 15-35 bps FY'22 NCO outlook
FY'22 outlook key assumptions
Q1'22 activity
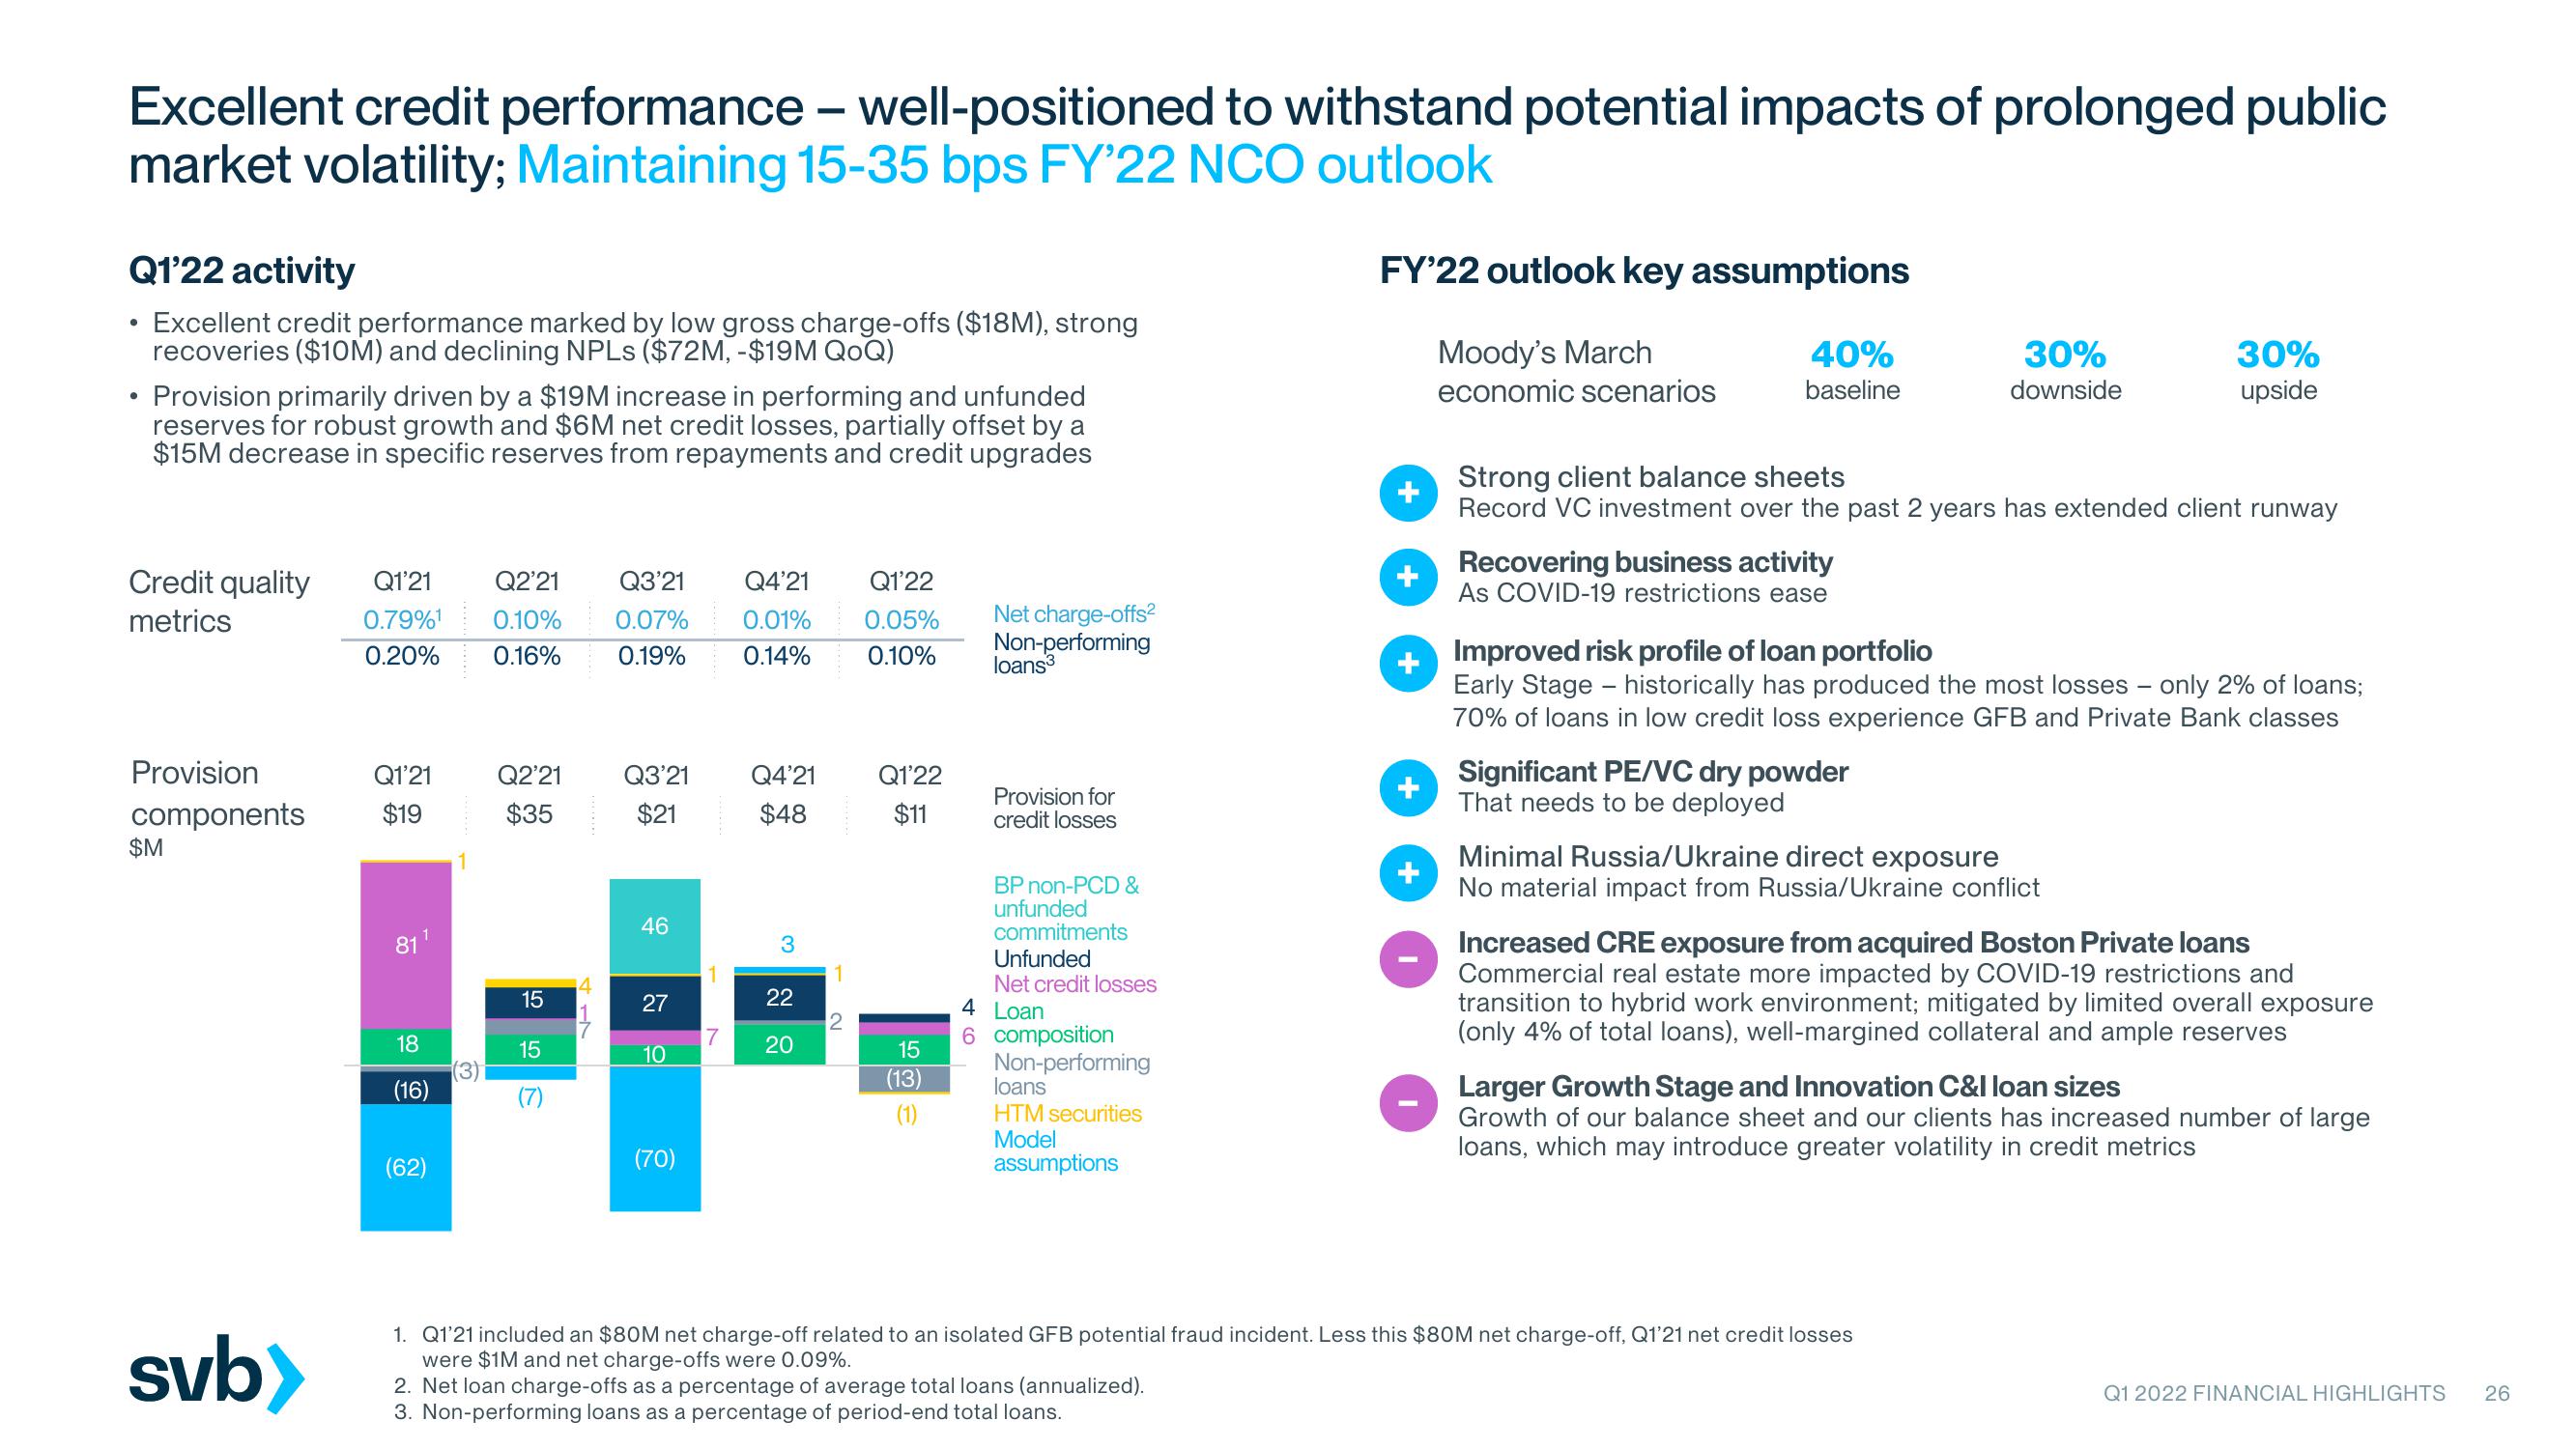
Excellent credit performance marked by low gross charge-offs ($18M), strong
recoveries ($10M) and declining NPLs ($72M, -$19M QOQ)
●
.
Provision primarily driven by a $19M increase in performing and unfunded
reserves for robust growth and $6M net credit losses, partially offset by a
$15M decrease in specific reserves from repayments and credit upgrades
Credit quality Q1'21
metrics
0.79%¹
0.20%
Provision
components
$M
svb>
Q1'21
$19
811
18
(16)
(62)
(3)
Q2'21
0.10%
0.16%
Q2'21
$35
15
15
(7)
4
0.07%
Q3'21 Q4'21 Q1'22
0.01% 0.05%
0.14% 0.10%
0.19%
Q3'21
$21
46
27
10
(70)
7
Q4'21
$48
3
22
20
2
Q1'22
$11
15
(13)
(1)
Net charge-offs²
Non-performing
loans³
Provision for
credit losses
BP non-PCD &
unfunded
commitments
Unfunded
Net credit losses
Loan
4
6 composition
Non-performing
loans
HTM securities
Model
assumptions
Moody's March
economic scenarios
2. Net loan charge-offs as a percentage of average total loans (annualized).
3. Non-performing loans as a percentage of period-end total loans.
40%
baseline
Recovering business activity
As COVID-19 restrictions ease
Strong client balance sheets
Record VC investment over the past 2 years has extended client runway
30%
downside
Significant PE/VC dry powder
That needs to be deployed
Improved risk profile of loan portfolio
Early Stage - historically has produced the most losses - only 2% of loans;
70% of loans in low credit loss experience GFB and Private Bank classes
30%
upside
Minimal Russia/Ukraine direct exposure
No material impact from Russia/Ukraine conflict
1. Q1'21 included an $80M net charge-off related to an isolated GFB potential fraud incident. Less this $80M net charge-off, Q1'21 net credit losses
were $1M and net charge-offs were 0.09%.
Increased CRE exposure from acquired Boston Private loans
Commercial real estate more impacted by COVID-19 restrictions and
transition to hybrid work environment; mitigated by limited overall exposure
(only 4% of total loans), well-margined collateral and ample reserves
Larger Growth Stage and Innovation C&I loan sizes
Growth of our balance sheet and our clients has increased number of large
loans, which may introduce greater volatility in credit metrics
Q1 2022 FINANCIAL HIGHLIGHTS
26View entire presentation