Silicon Valley Bank Results Presentation Deck
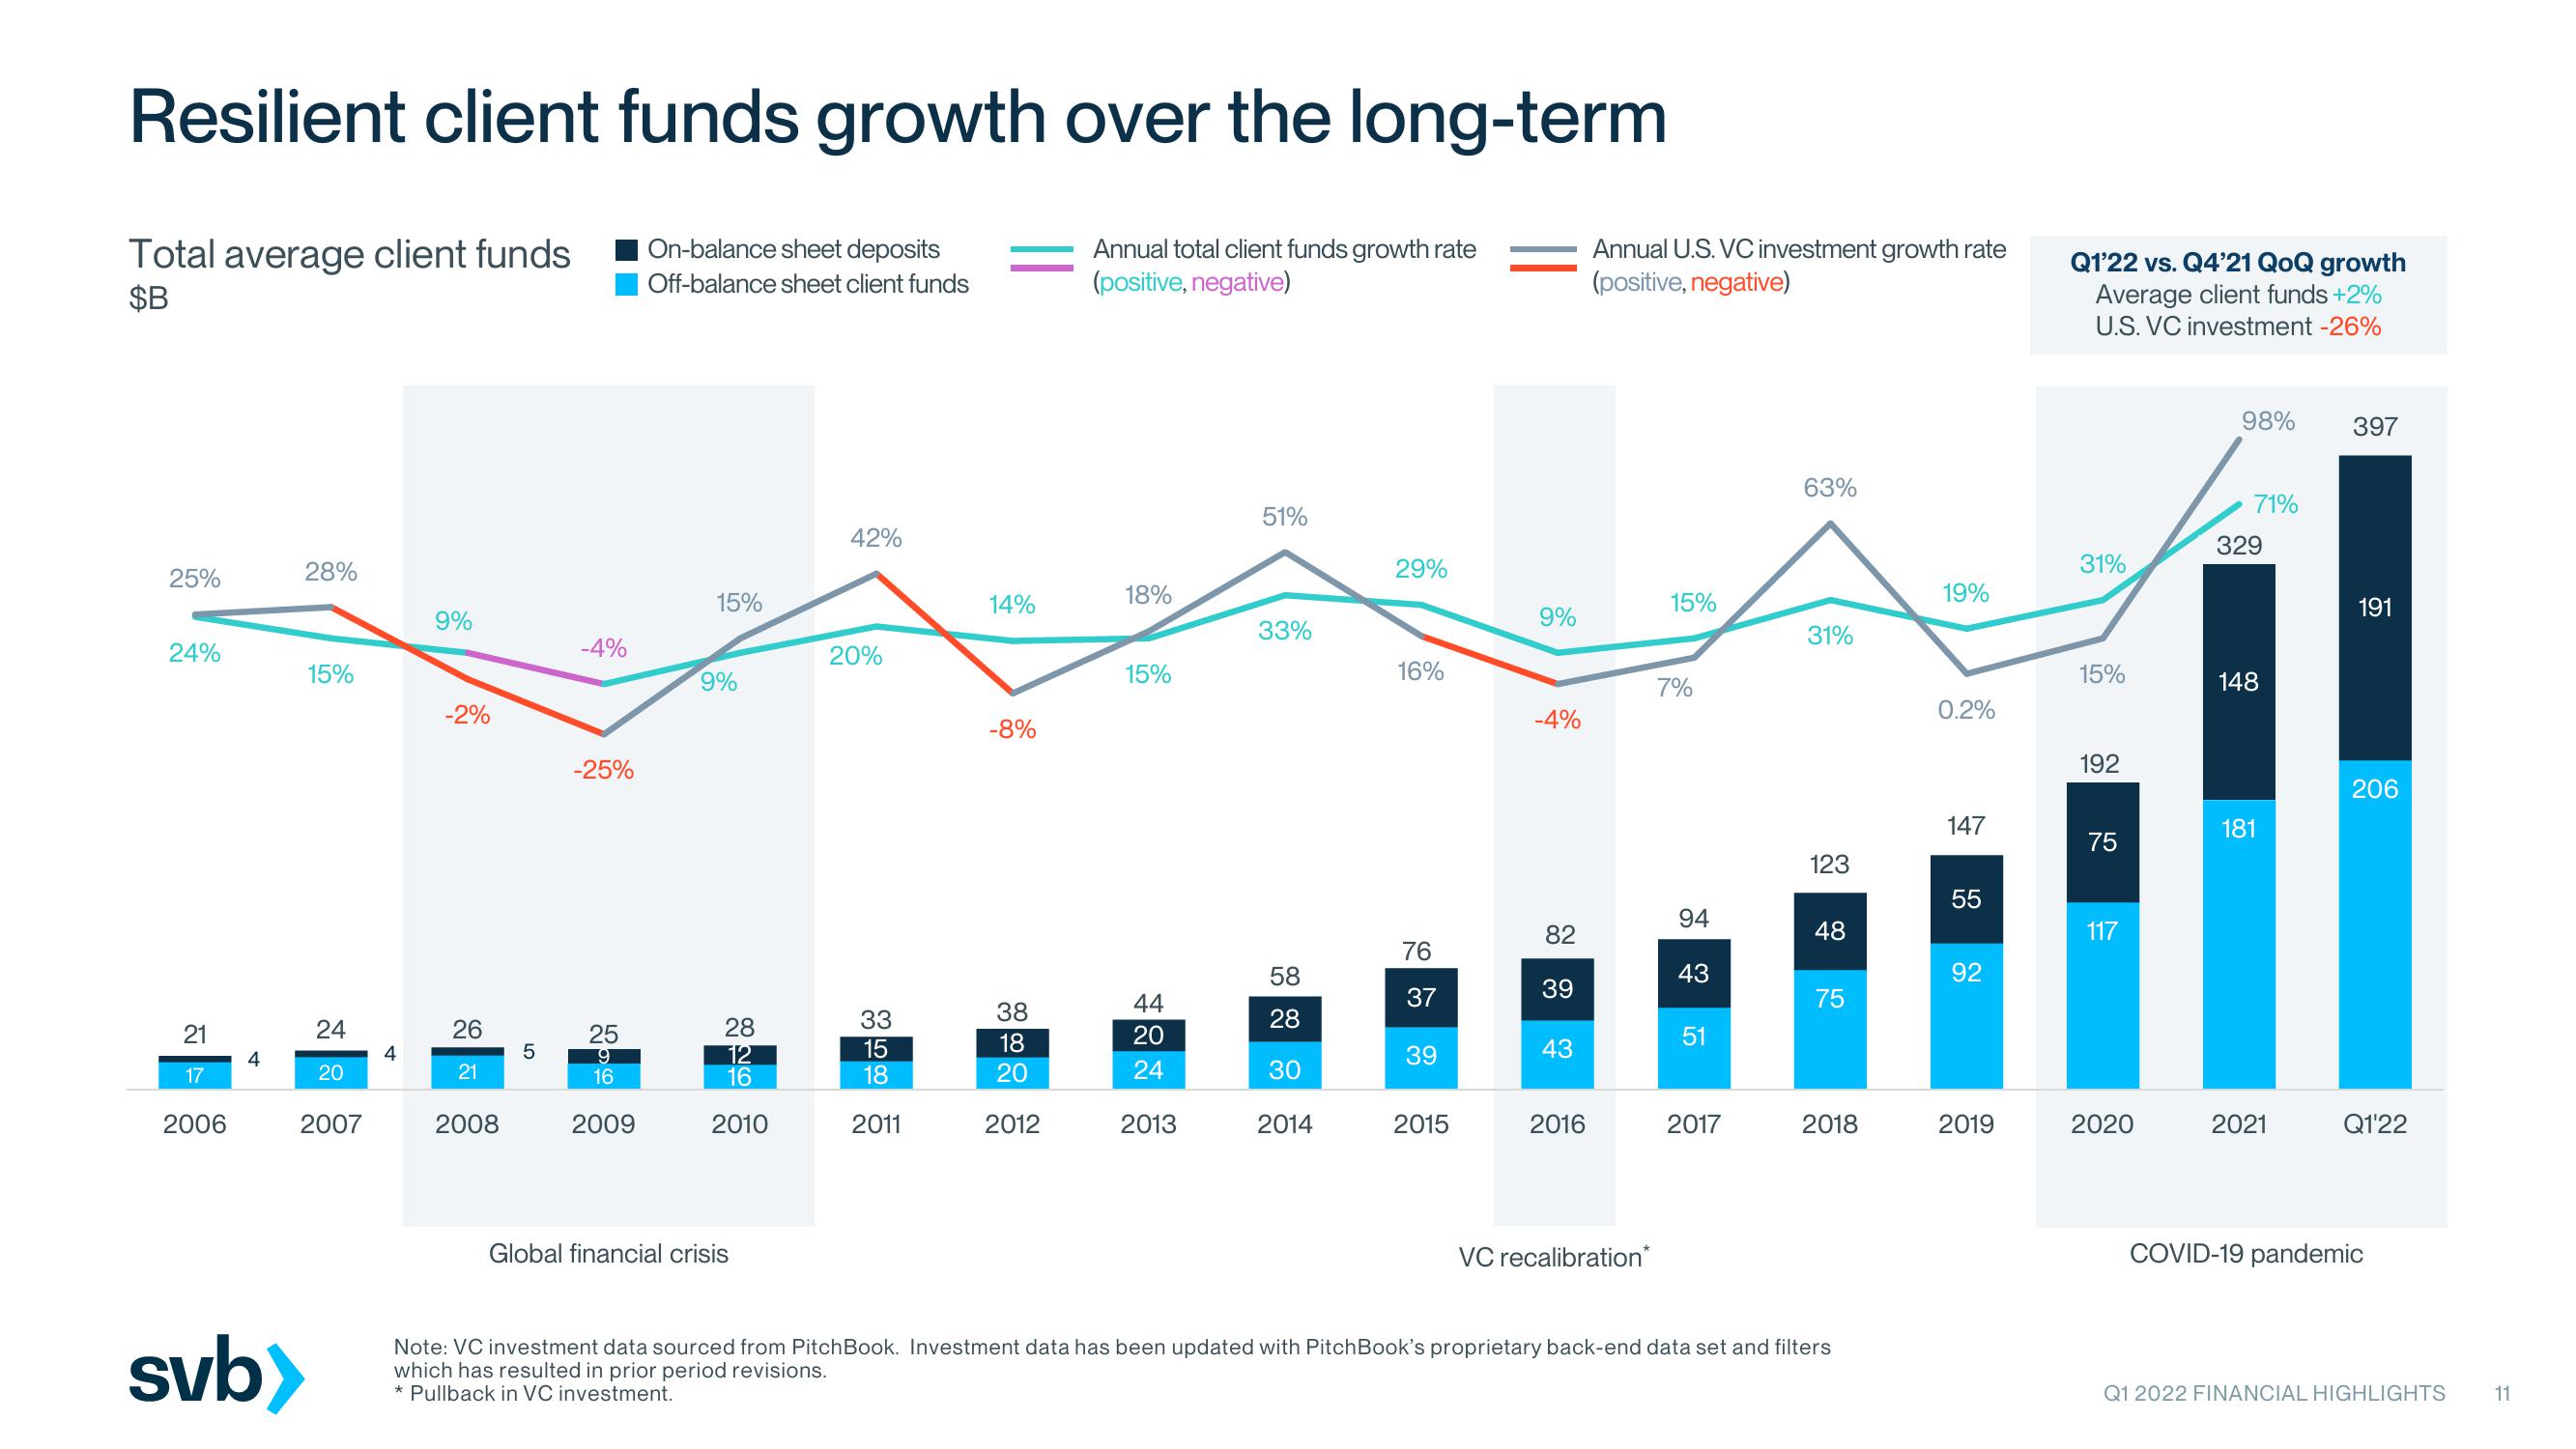
Resilient client funds growth over the long-term
On-balance sheet deposits
Off-balance sheet client funds
Annual total client funds growth rate
(positive, negative)
Total average client funds
$B
25%
24%
21
17
2006
4
28%
svb>
15%
24
20
2007
4
9%
-2%
26
21
2008
5
-4%
-25%
25
9
16
2009
15%
9%
28
12
16
2010
Global financial crisis
42%
20%
33
15
18
2011
14%
-8%
38
18
20
2012
18%
15%
44
20
24
2013
51%
33%
58
28
30
2014
29%
16%
76
37
39
2015
9%
-4%
82
39
43
2016
Annual U.S. VC investment growth rate
(positive, negative)
VC recalibration*
15%
7%
94
43
51
2017
63%
31%
48
329
31%
19%
191
15%
148
0.2%
192
all
206
147
181
75
123
55
117
92
75
2018
Note: VC investment data sourced from PitchBook. Investment data has been updated with PitchBook's proprietary back-end data set and filters
which has resulted in prior period revisions.
* Pullback in VC investment.
Q1'22 vs. Q4'21 QoQ growth
Average client funds +2%
U.S. VC investment -26%
2019
98%
2020
71%
397
2021
Q1'22
COVID-19 pandemic
Q1 2022 FINANCIAL HIGHLIGHTS
11View entire presentation