Silicon Valley Bank Results Presentation Deck
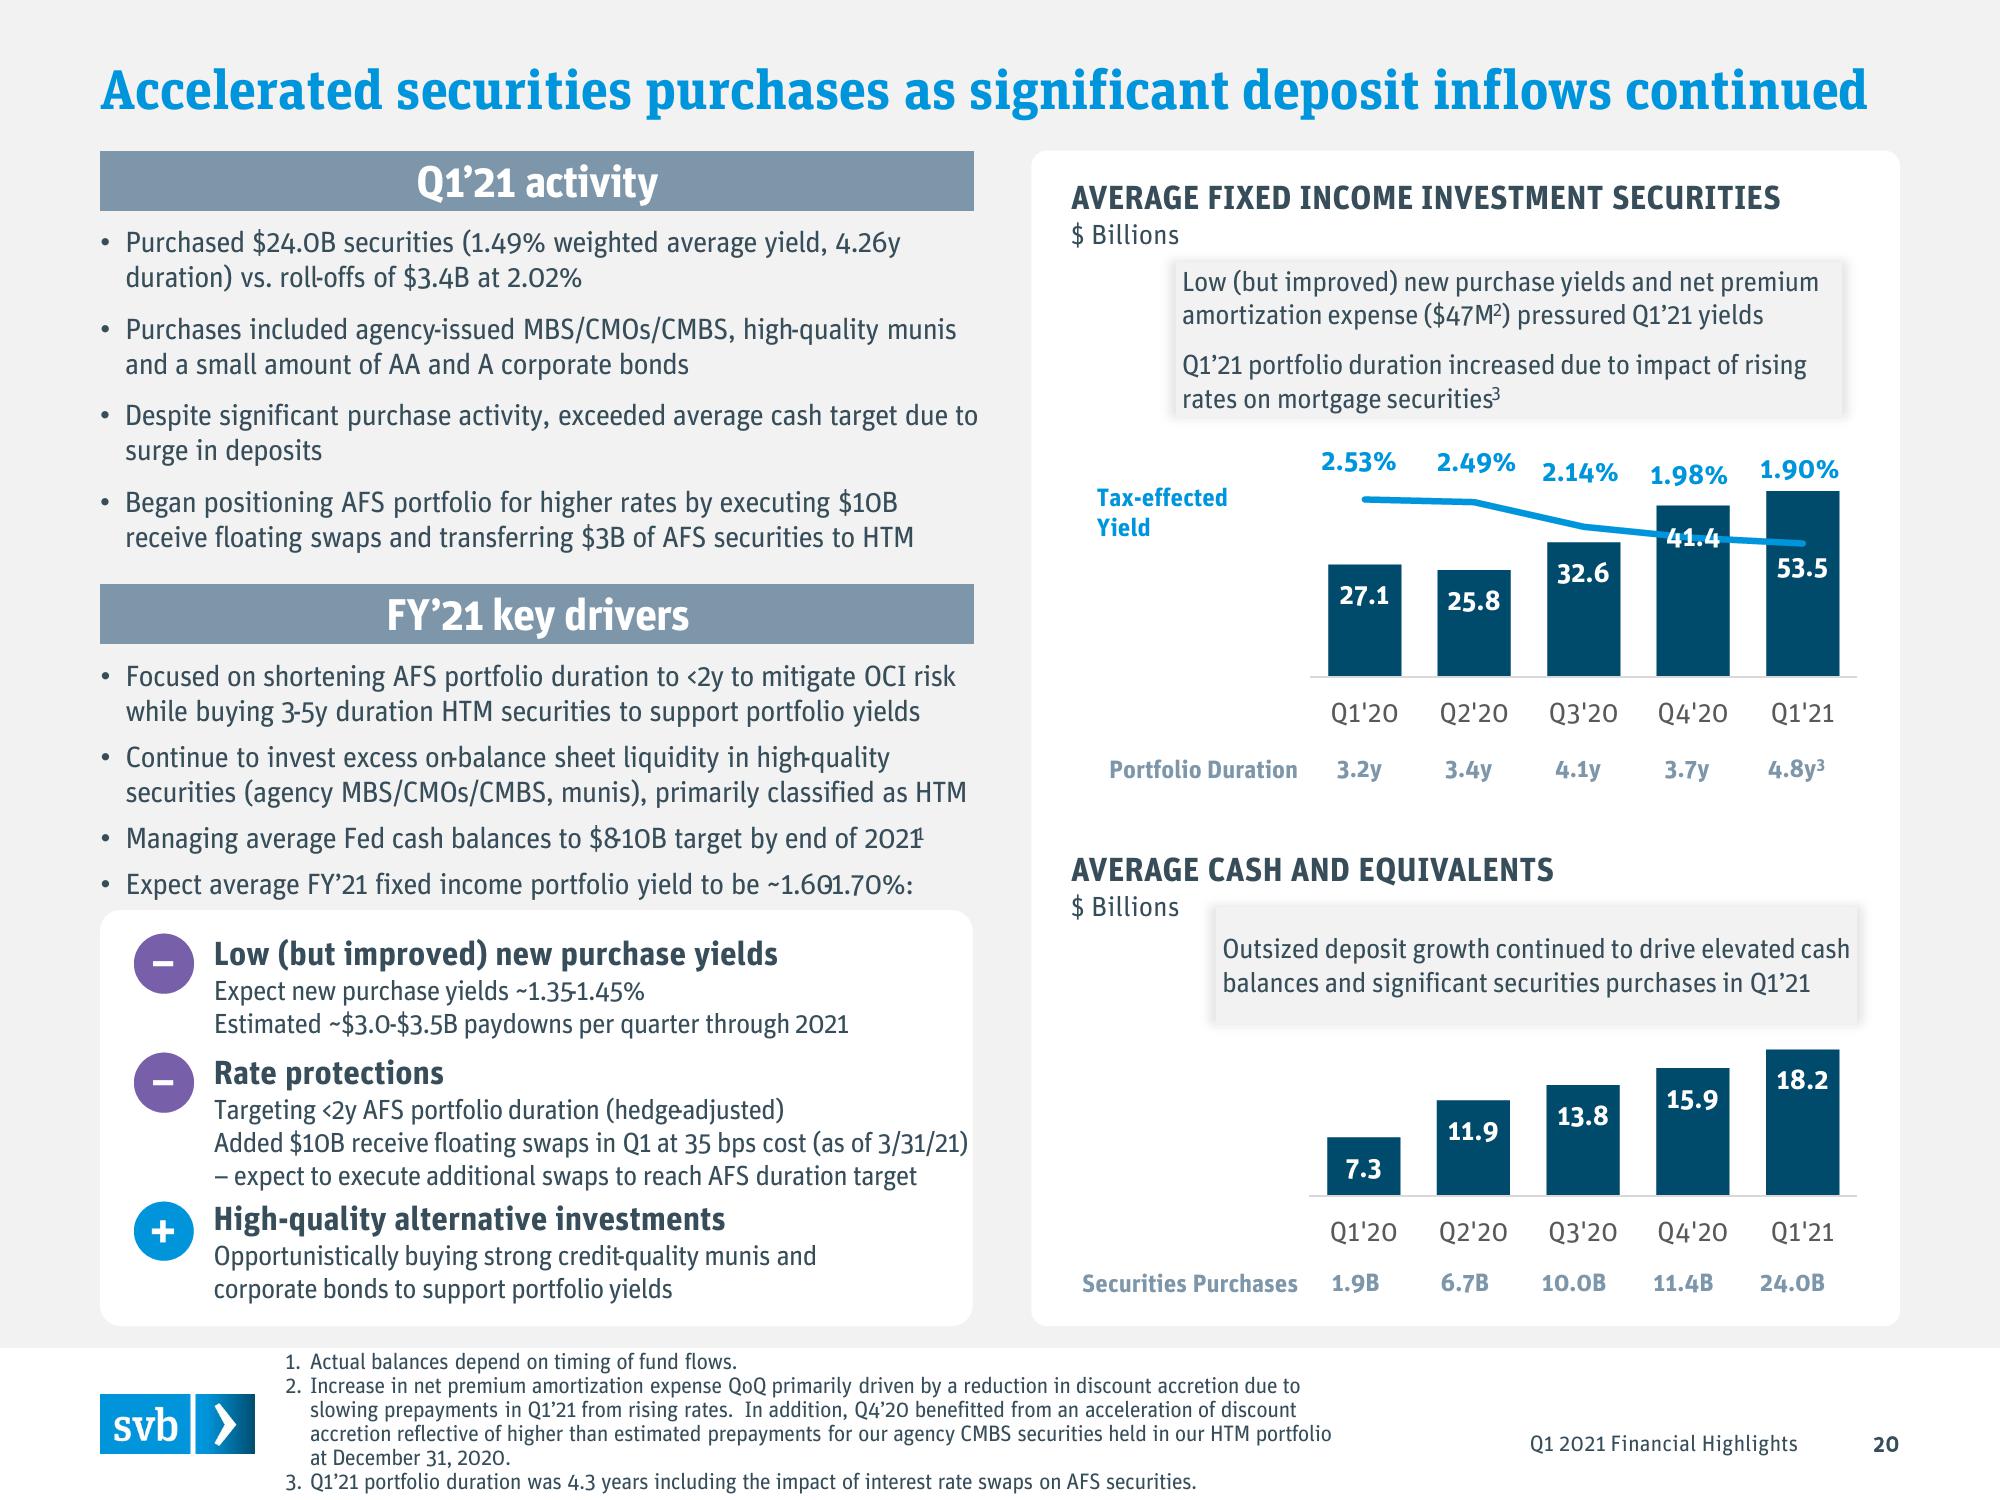
Accelerated securities purchases as significant deposit inflows continued
Q1'21 activity
Purchased $24.OB securities (1.49% weighted average yield, 4.26y
duration) vs. roll-offs of $3.4B at 2.02%
●
.
Purchases included agency-issued MBS/CMOS/CMBS, high-quality munis
and a small amount of AA and A corporate bonds
●
Despite significant purchase activity, exceeded average cash target due to
surge in deposits
Began positioning AFS portfolio for higher rates by executing $10B
receive floating swaps and transferring $3B of AFS securities to HTM
FY'21 key drivers
Focused on shortening AFS portfolio duration to <2y to mitigate OCI risk
while buying 3-5y duration HTM securities to support portfolio yields
Continue to invest excess on-balance sheet liquidity in high-quality
securities (agency MBS/CMOS/CMBS, munis), primarily classified as HTM
• Managing average Fed cash balances to $810B target by end of 2021
Expect average FY'21 fixed income portfolio yield to be ~1.601.70%:
+
Low (but improved) new purchase yields
Expect new purchase yields ~1.35-1.45%
Estimated $3.0-$3.5B paydowns per quarter through 2021
Rate protections
Targeting <2y AFS portfolio duration (hedgeadjusted)
Added $10B receive floating swaps in Q1 at 35 bps cost (as of 3/31/21)
- expect to execute additional swaps to reach AFS duration target
High-quality alternative investments
Opportunistically buying strong credit-quality munis and
corporate bonds to support portfolio yields
svb >
AVERAGE FIXED INCOME INVESTMENT SECURITIES
$ Billions
Low (but improved) new purchase yields and net premium
amortization expense ($47M²) pressured Q1'21 yields
Q1'21 portfolio duration increased due to impact of rising
rates on mortgage securities³
2.53% 2.49% 2.14% 1.98% 1.90%
Tax-effected
Yield
27.1 25.8
Portfolio Duration 3.2y
Q1'20 Q2'20 Q3'20
3.4y
AVERAGE CASH AND EQUIVALENTS
$ Billions
Securities Purchases
1. Actual balances depend on timing of fund flows.
2. Increase in net premium amortization expense QoQ primarily driven by a reduction in discount accretion due to
slowing prepayments in Q1'21 from rising rates. In addition, Q4'20 benefitted from an acceleration of discount
accretion reflective of higher than estimated prepayments for our agency CMBS securities held in our HTM portfolio
at December 31, 2020.
3. Q1'21 portfolio duration was 4.3 years including the impact of interest rate swaps on AFS securities.
7.3
Q1'20
1.9B
32.6
Outsized deposit growth continued to drive elevated cash
balances and significant securities purchases in Q1'21
11.9
41.4
Q4'20 Q1'21
4.1y 3.7y 4.8y³
13.8
53.5
15.9
18.2
Q2'20 Q3'20 Q4'20 Q1'21
6.7B
10.0B 11.4B
24.0B
Q1 2021 Financial Highlights
20View entire presentation