Company Overview
FLORA
GROWTH
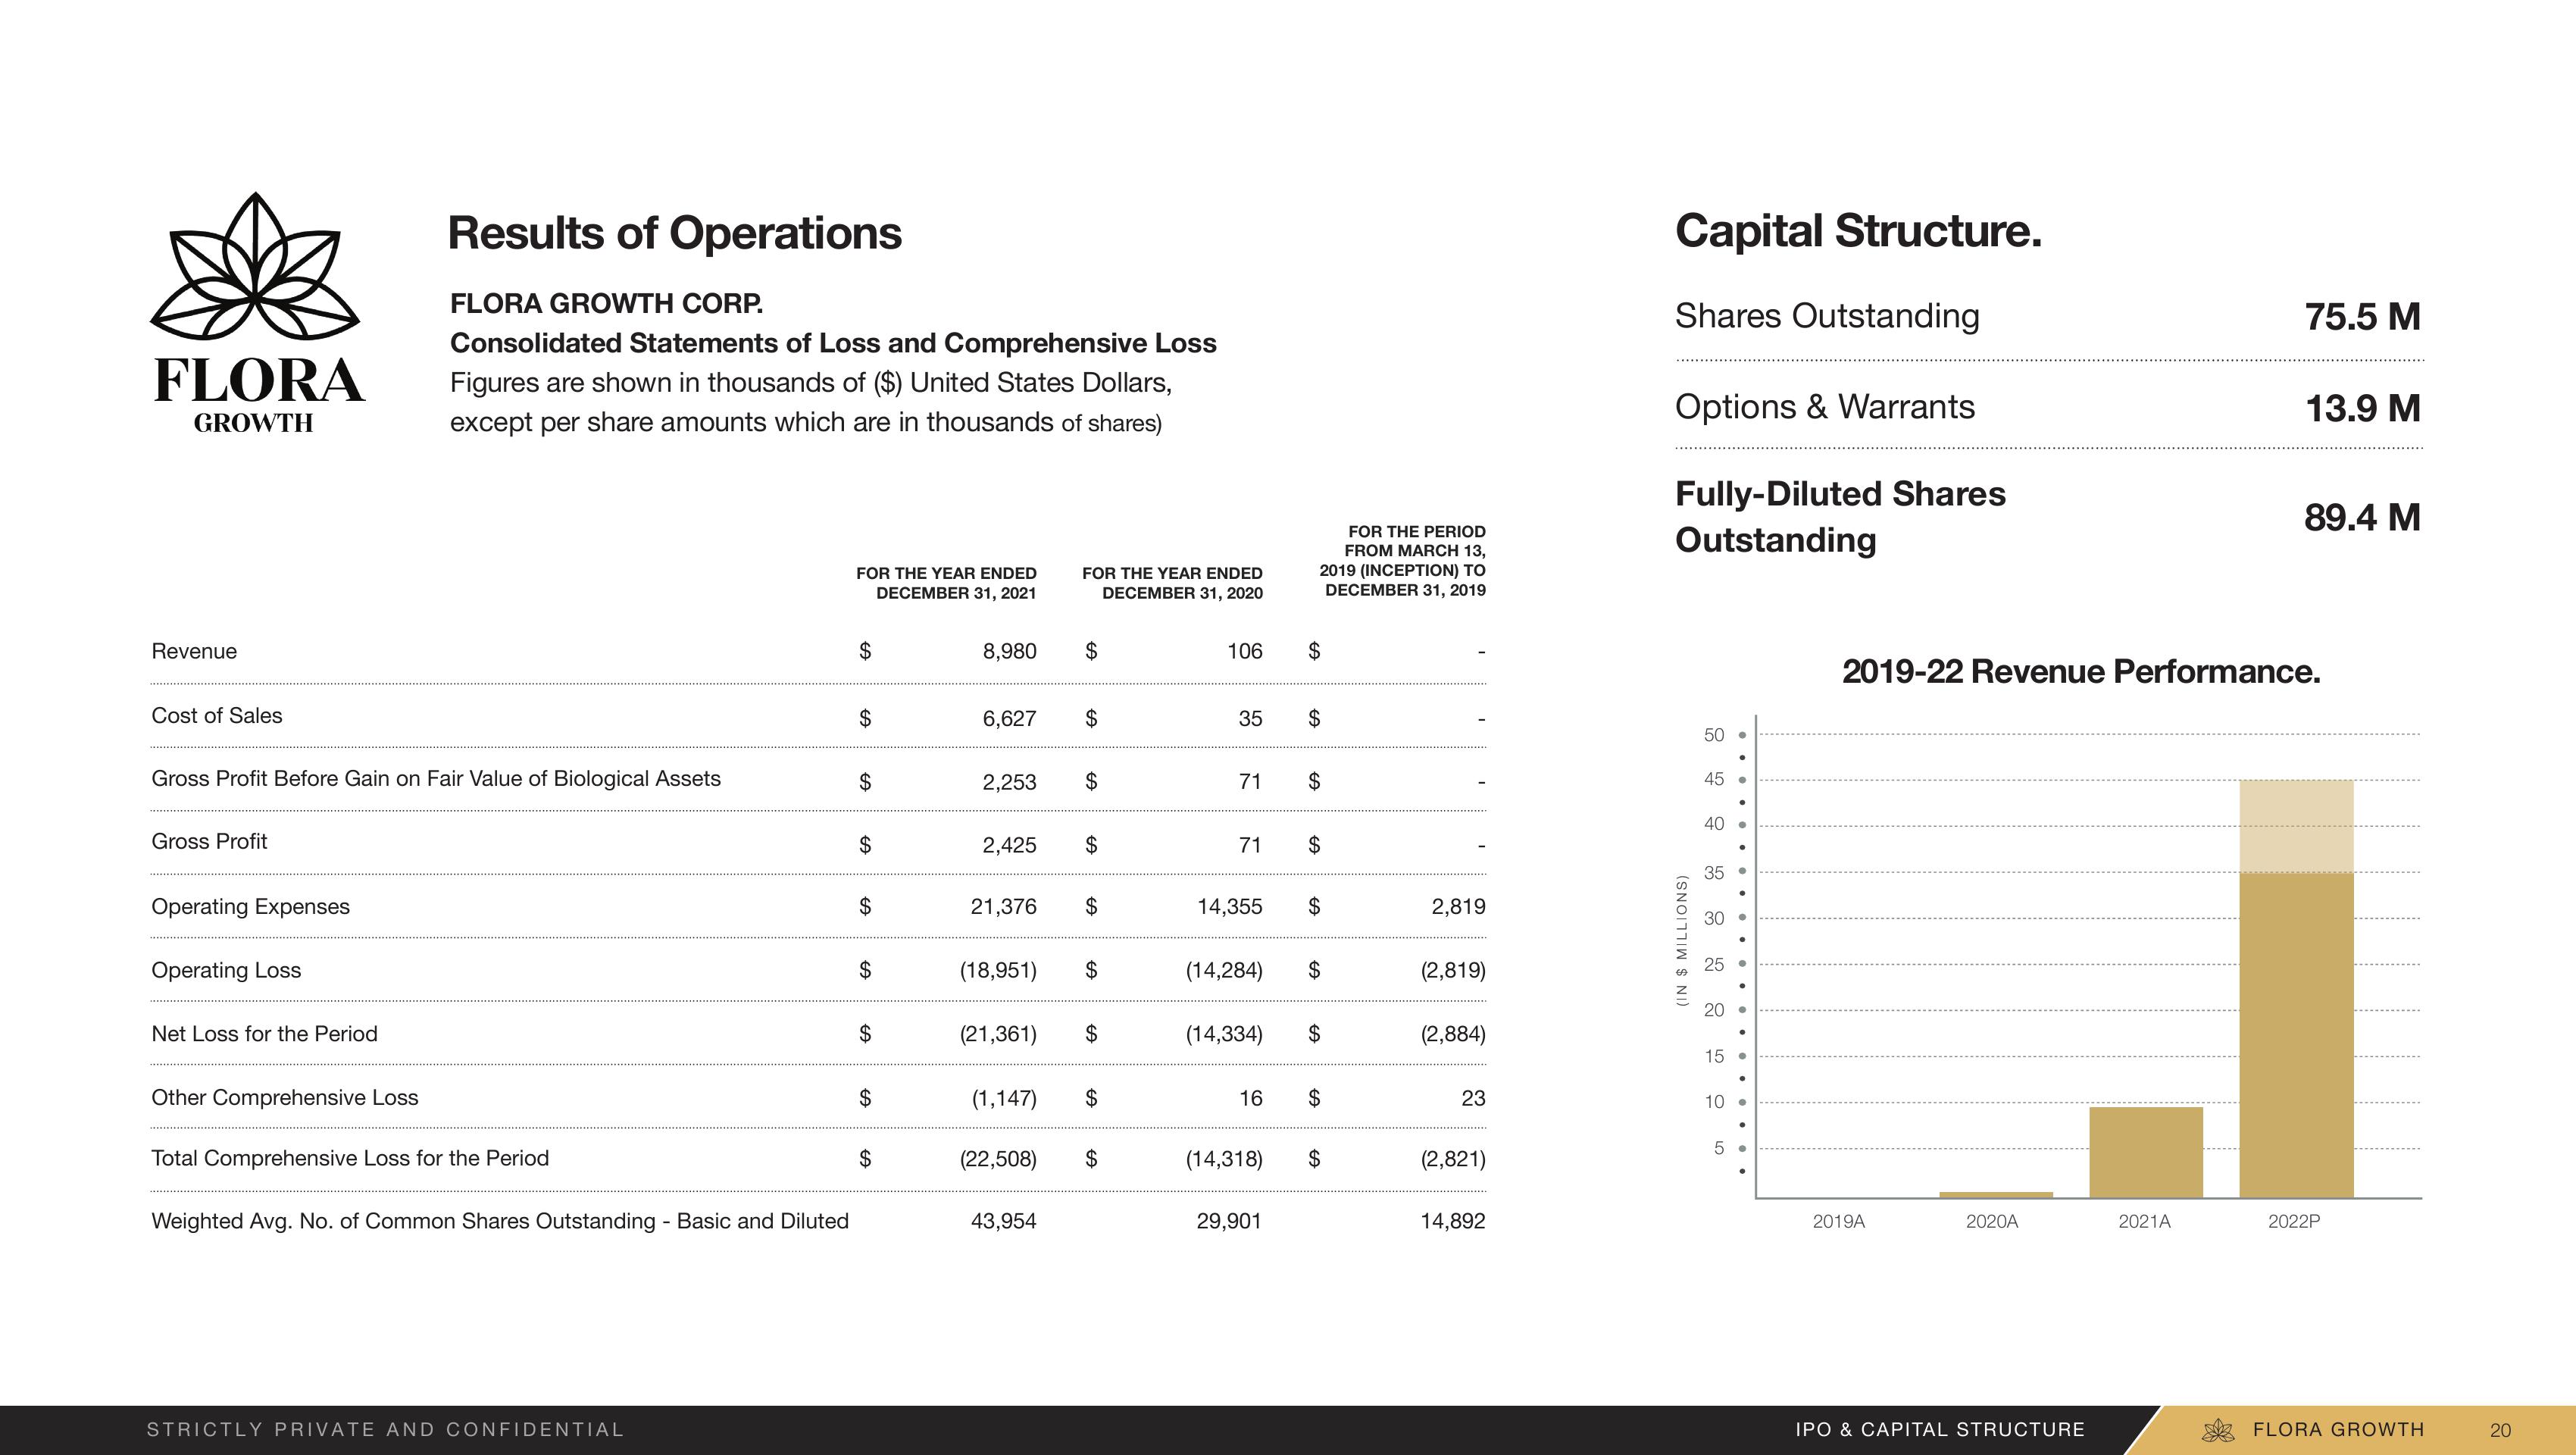
Revenue
Cost of Sales
Gross Profit
Gross Profit Before Gain on Fair Value of Biological Assets
Operating Expenses
Operating Loss
Net Loss for the Period
Results of Operations
Other Comprehensive Loss
FLORA GROWTH CORP.
Consolidated Statements of Loss and Comprehensive Loss
Figures are shown in thousands of ($) United States Dollars,
except per share amounts which are in thousands of shares)
Total Comprehensive Loss for the Period
Weighted Avg. No. of Common Shares Outstanding - Basic and Diluted
STRICTLY PRIVATE AND CONFIDENTIAL
FOR THE YEAR ENDED
DECEMBER 31, 2021
$
$
$
$
A
$
$
8,980
6,627
2,253
2,425
(18,951)
(1,147)
FOR THE YEAR ENDED
DECEMBER 31, 2020
(22,508)
$
21,376 $
43,954
$
$
$
(21,361) $
$
$
$
106
35
71
14,355
(14,284)
71 $
(14,334)
16
(14,318)
FOR THE PERIOD
FROM MARCH 13,
2019 (INCEPTION) TO
DECEMBER 31, 2019
29,901
$
$
$
$
$
$
2,819
(2,819)
(2,884)
23
(2,821)
14,892
Capital Structure.
Shares Outstanding
Options & Warrants
Fully-Diluted Shares
Outstanding
(IN $ MILLIONS)
50.
45.
40.
●
35.
30.
25
20
15.
10.
5.
2019A
2020A
2019-22 Revenue Performance.
IPO & CAPITAL STRUCTURE
75.5 M
2021A
13.9 M
89.4 M
2022P
FLORA GROWTH
20View entire presentation