Silicon Valley Bank Results Presentation Deck
Overall stable credit trends and improving economic environment
Expect 2021 NCOs to be between 20-40 bps
Q1'21 activity
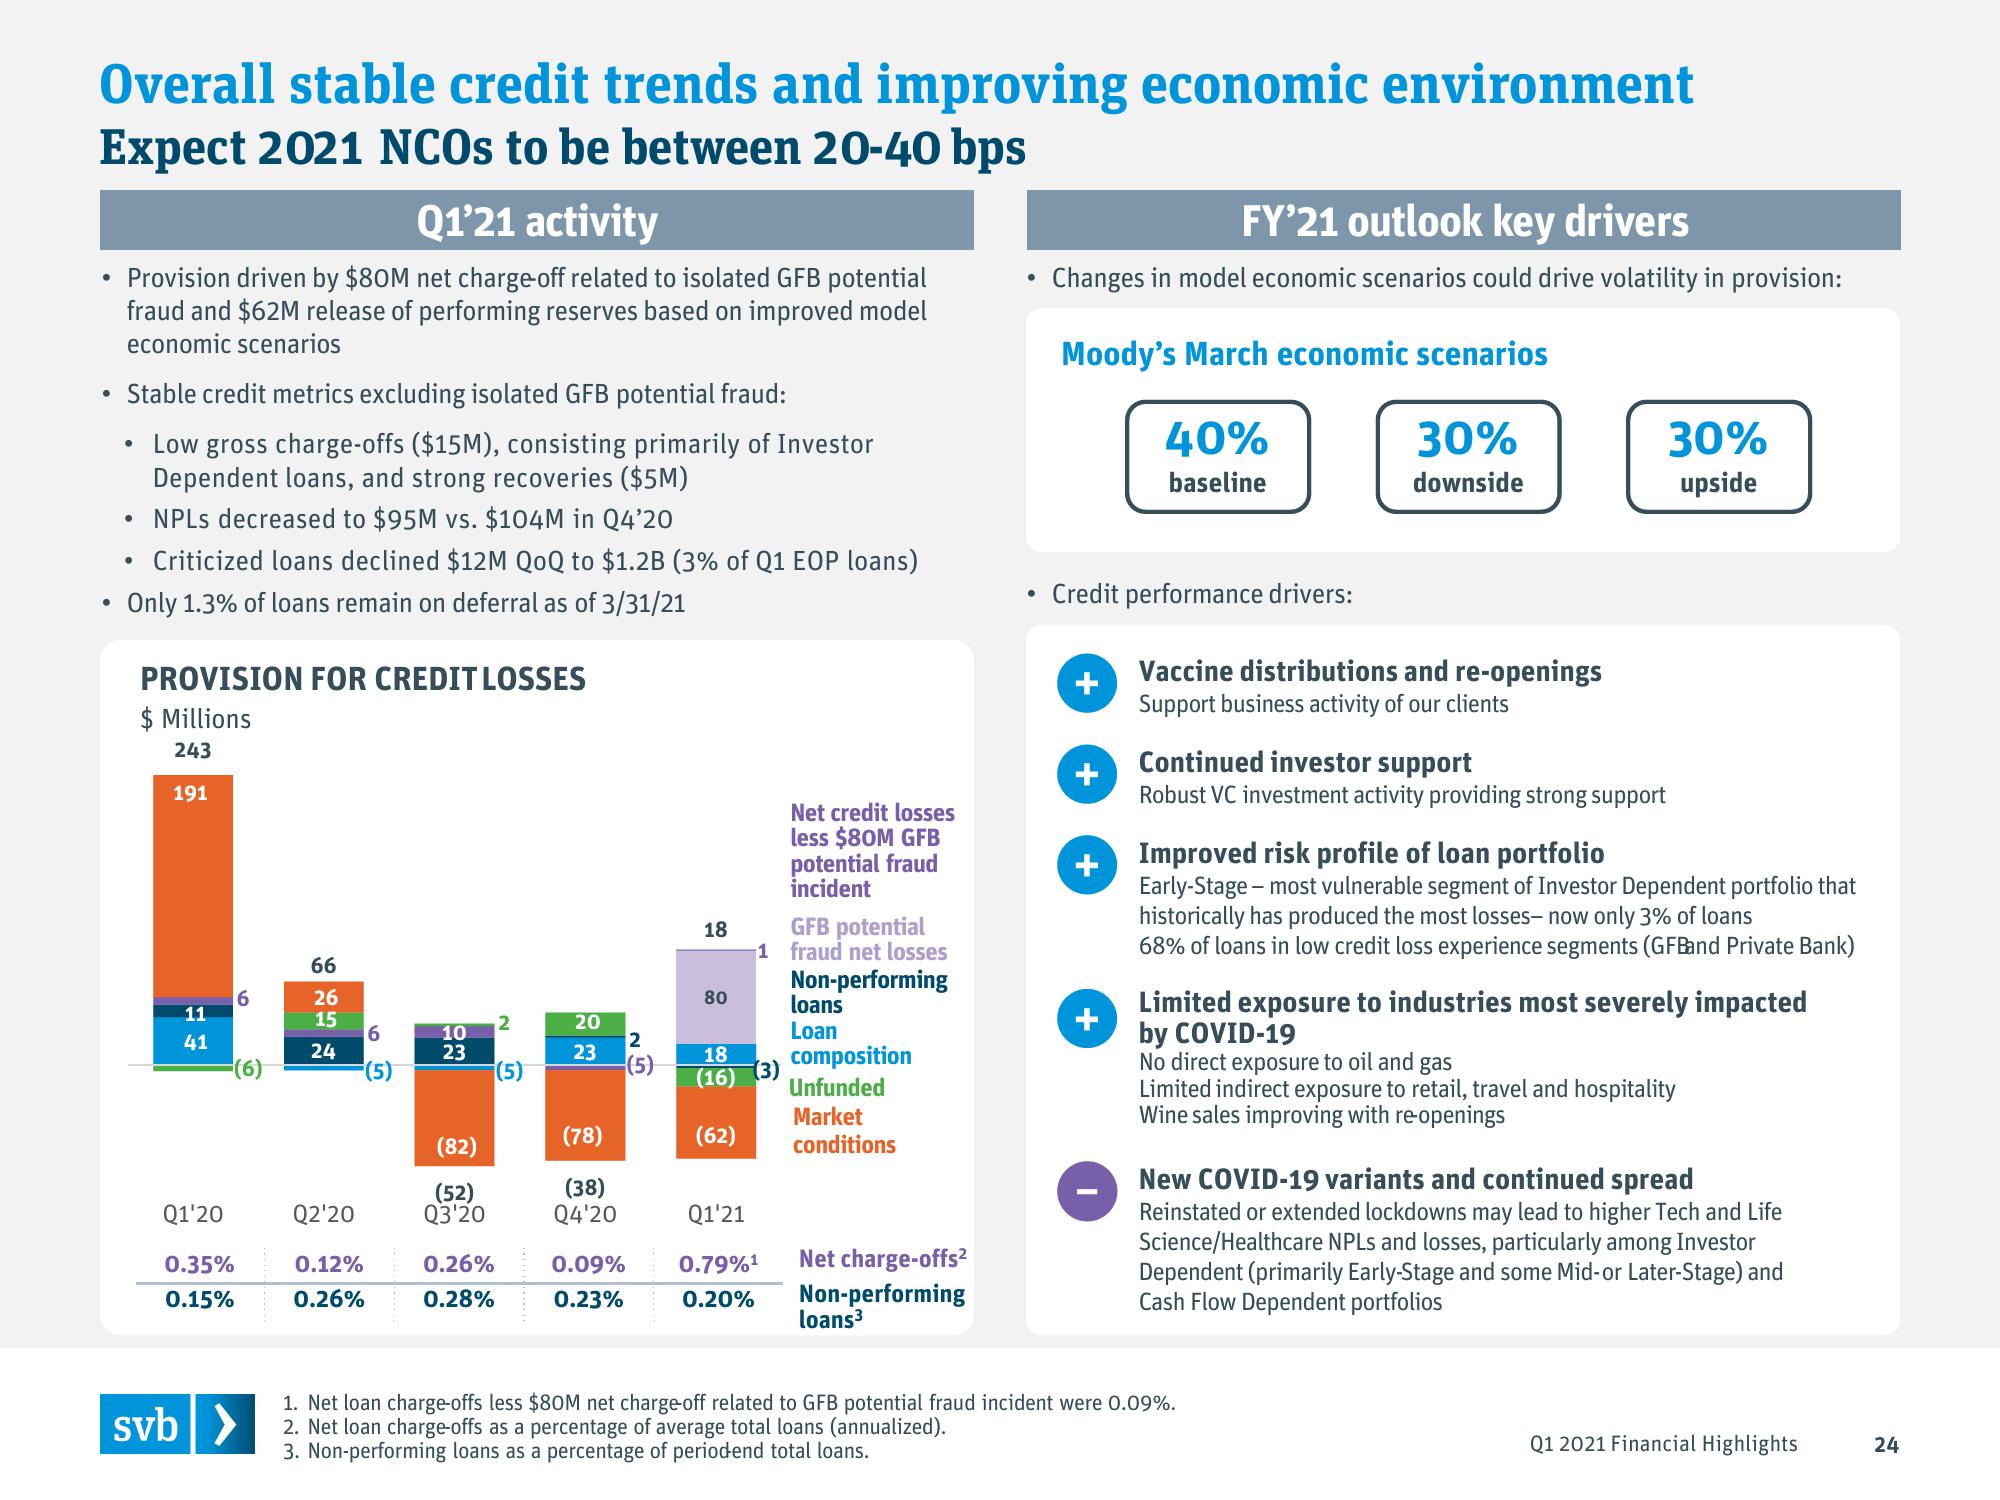
• Provision driven by $80M net charge-off related to isolated GFB potential
fraud and $62M release of performing reserves based on improved model
economic scenarios
●
Stable credit metrics excluding isolated GFB potential fraud:
• Low gross charge-offs ($15M), consisting primarily of Investor
Dependent loans, and strong recoveries ($5M)
• NPLs decreased to $95M vs. $104M in Q4'20
Criticized loans declined $12M QoQ to $1.2B (3% of Q1 EOP loans)
Only 1.3% of loans remain on deferral as of 3/31/21
PROVISION FOR CREDIT LOSSES
$ Millions
243
191
11
41
Q1'20
0.35%
0.15%
6
(6)
svb>
66
26
15
24
Q2'20
0.12%
0.26%
6
10
23
(82)
(52)
Q3'20
0.26%
0.28%
2
(5)
20
23
(78)
(38)
Q4'20
0.09%
0.23%
2
(5)
18
80
18
(16)
(62)
GFB potential
1 fraud net losses
Non-performing
(3)
Net credit losses
less $80M GFB
potential fraud
incident
Q1'21
0.79%¹
0.20%
loans
Loan
composition
Unfunded
Market
conditions
Net charge-offs²
Non-performing
loans³
FY'21 outlook key drivers
Changes in model economic scenarios could drive volatility in provision:
Moody's March economic scenarios
40%
30%
baseline
downside
Credit performance drivers:
+
+
Vaccine distributions and re-openings
Support business activity of our clients
Continued investor support
Robust VC investment activity providing strong support
30%
upside
Improved risk profile of loan portfolio
Early-Stage - most vulnerable segment of Investor Dependent portfolio that
historically has produced the most losses- now only 3% of loans
68% of loans in low credit loss experience segments (GFBand Private Bank)
Limited exposure to industries most severely impacted
by COVID-19
No direct exposure to oil and gas
Limited indirect exposure to retail, travel and hospitality
Wine sales improving with re-openings
New COVID-19 variants and continued spread
Reinstated or extended lockdowns may lead to higher Tech and Life
Science/Healthcare NPLs and losses, particularly among Investor
Dependent (primarily Early-Stage and some Mid-or Later-Stage) and
Cash Flow Dependent portfolios
1. Net loan charge-offs less $80M net charge-off related to GFB potential fraud incident were 0.09%.
2. Net loan charge-offs as a percentage of average total loans (annualized).
3. Non-performing loans as a percentage of periodend total loans.
Q1 2021 Financial Highlights
24View entire presentation