Silicon Valley Bank Results Presentation Deck
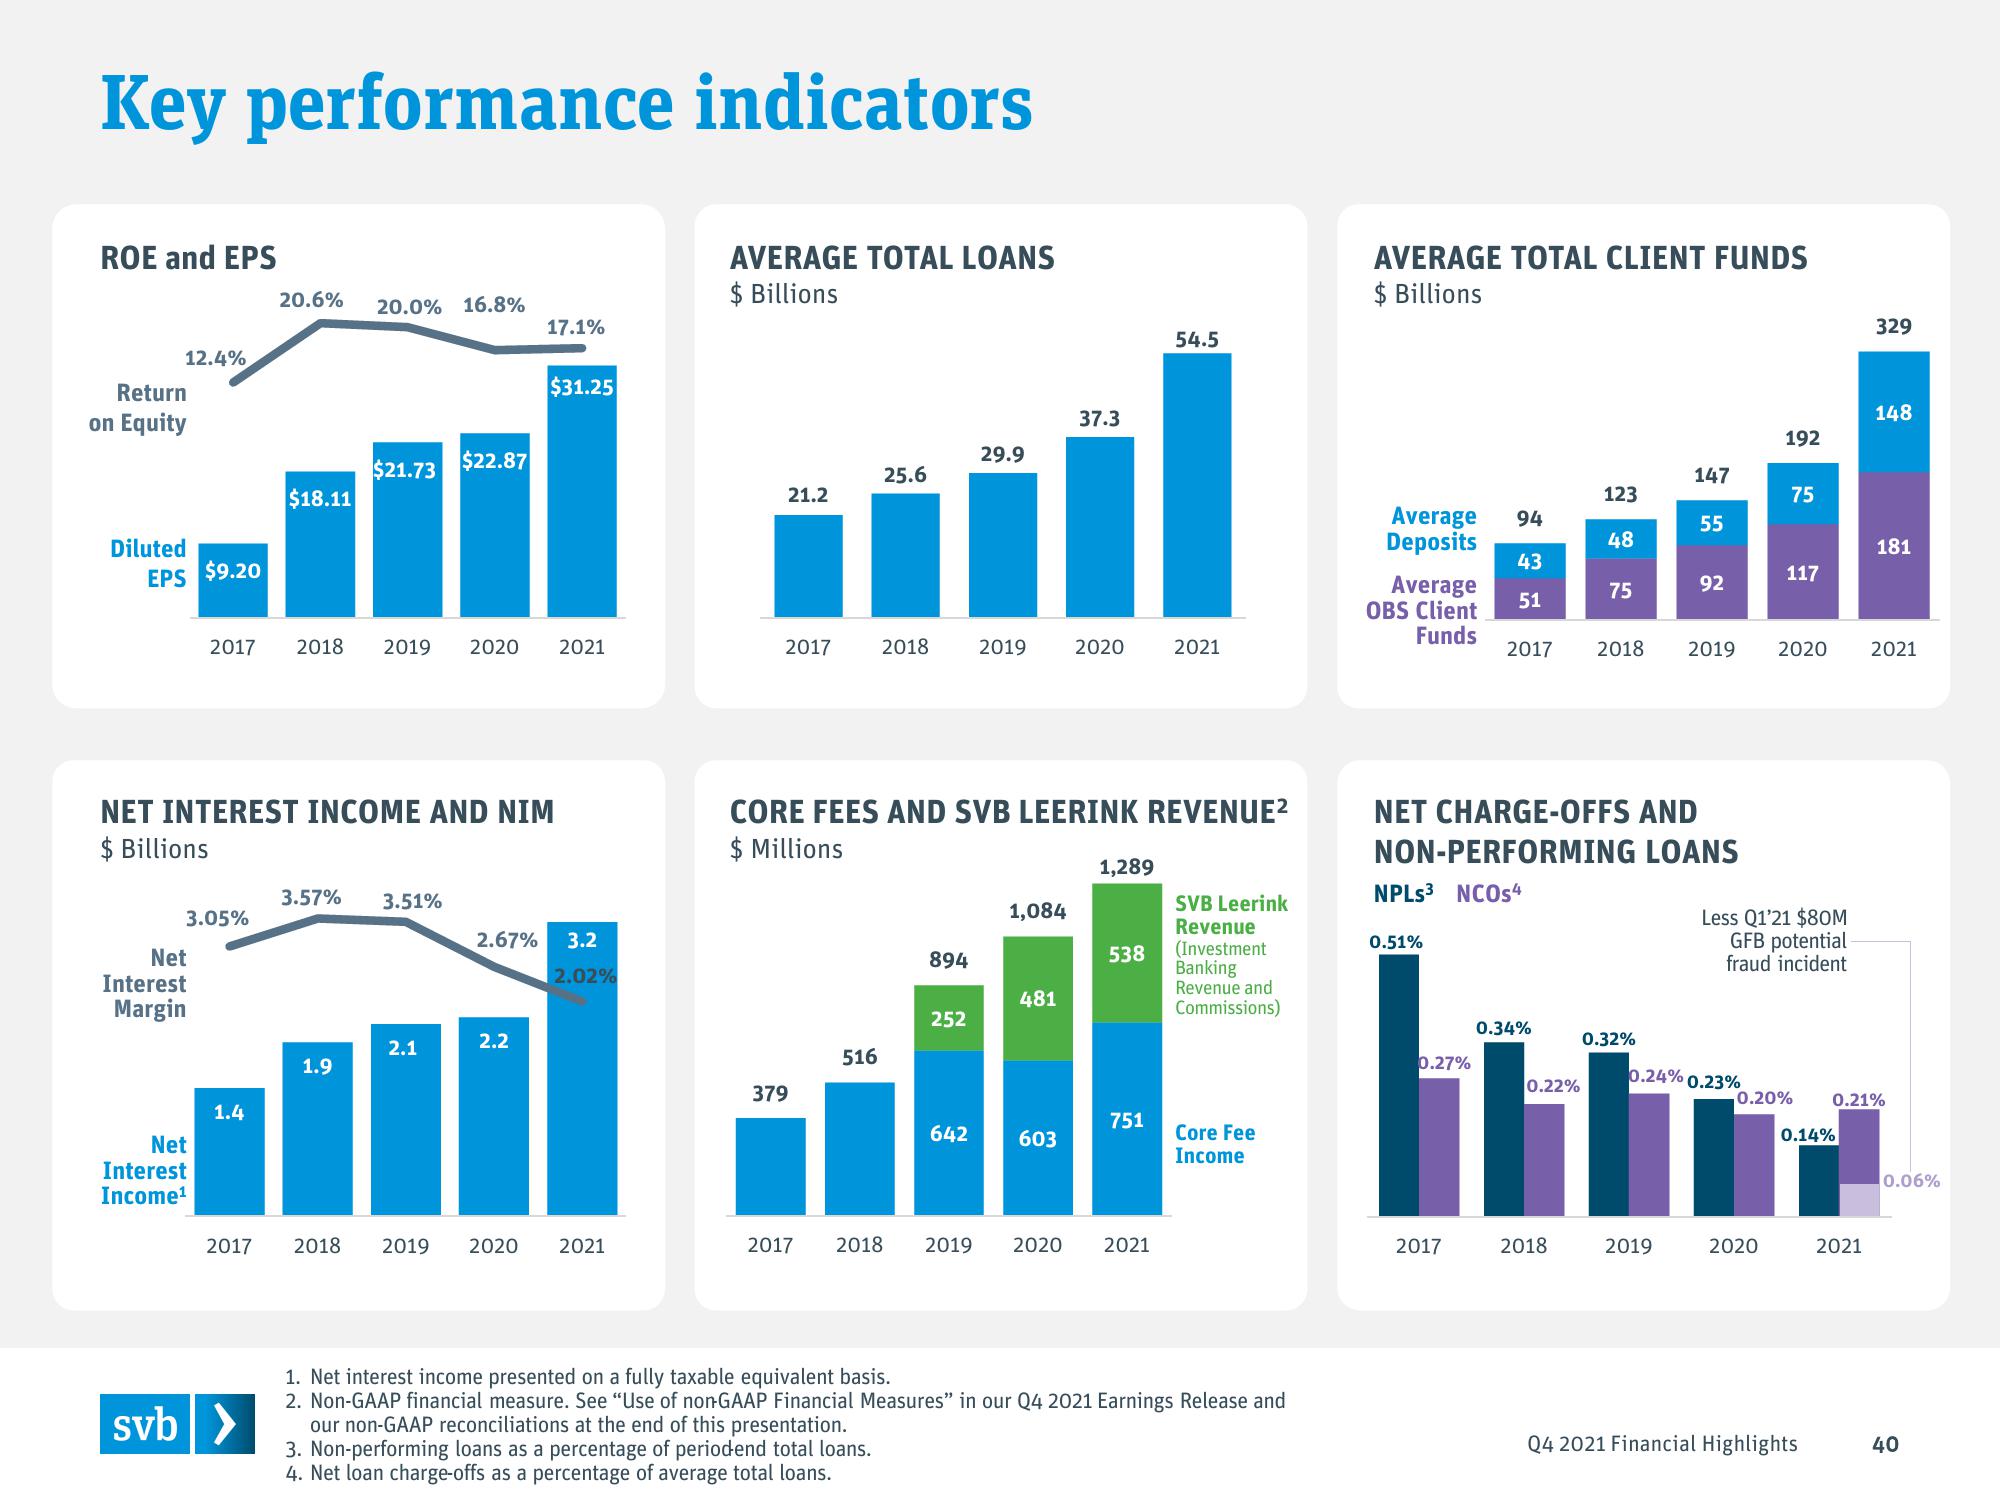
Key performance indicators
ROE and EPS
12.4%
Return
on Equity
Diluted
EPS $9.20
3.05%
Net
Interest
Margin
Net
Interest
Income¹
1.4
20.6%
2017
$18.11
svb >
NET INTEREST INCOME AND NIM
$ Billions
2017 2018 2019 2020 2021
20.0% 16.8%
3.57%
$21.73
1.9
3.51%
$22.87
2.1
2018 2019
17.1%
$31.25
2.2
2.67% 3.2
2.02%
2020 2021
AVERAGE TOTAL LOANS
$ Billions
21.2
2017
379
2017
25.6
516
2018
894
252
29.9
CORE FEES AND SVB LEERINK REVENUE²
$ Millions
642
2019
1,084
481
37.3
603
2020
1,289
538
751
54.5
2018 2019 2020 2021
2021
SVB Leerink
Revenue
(Investment
Banking
Revenue and
Commissions)
Core Fee
Income
1. Net interest income presented on a fully taxable equivalent basis.
2. Non-GAAP financial measure. See "Use of non-GAAP Financial Measures" in our Q4 2021 Earnings Release and
our non-GAAP reconciliations at the end of this presentation.
3. Non-performing loans as a percentage of periodend total loans.
4. Net loan charge-offs as a percentage of average total loans.
AVERAGE TOTAL CLIENT FUNDS
$ Billions
Average
Deposits
Average
OBS Client
Funds
0.51%
0.27%
94
43
51
2017
0.34%
123
48
NET CHARGE-OFFS AND
NON-PERFORMING LOANS
NPLS3 NCOs4
0.22%
75
2018
147
0.32%
55
92
2019
2017 2018 2019 2020 2021
0.24% 0.23%
192
75
117
Less Q1'21 $80M
GFB potential
fraud incident
2020
-0.20%
0.14%
Q4 2021 Financial Highlights
329
148
2021
181
0.21%
0.06%
40View entire presentation