Apollo Global Management Investor Presentation Deck
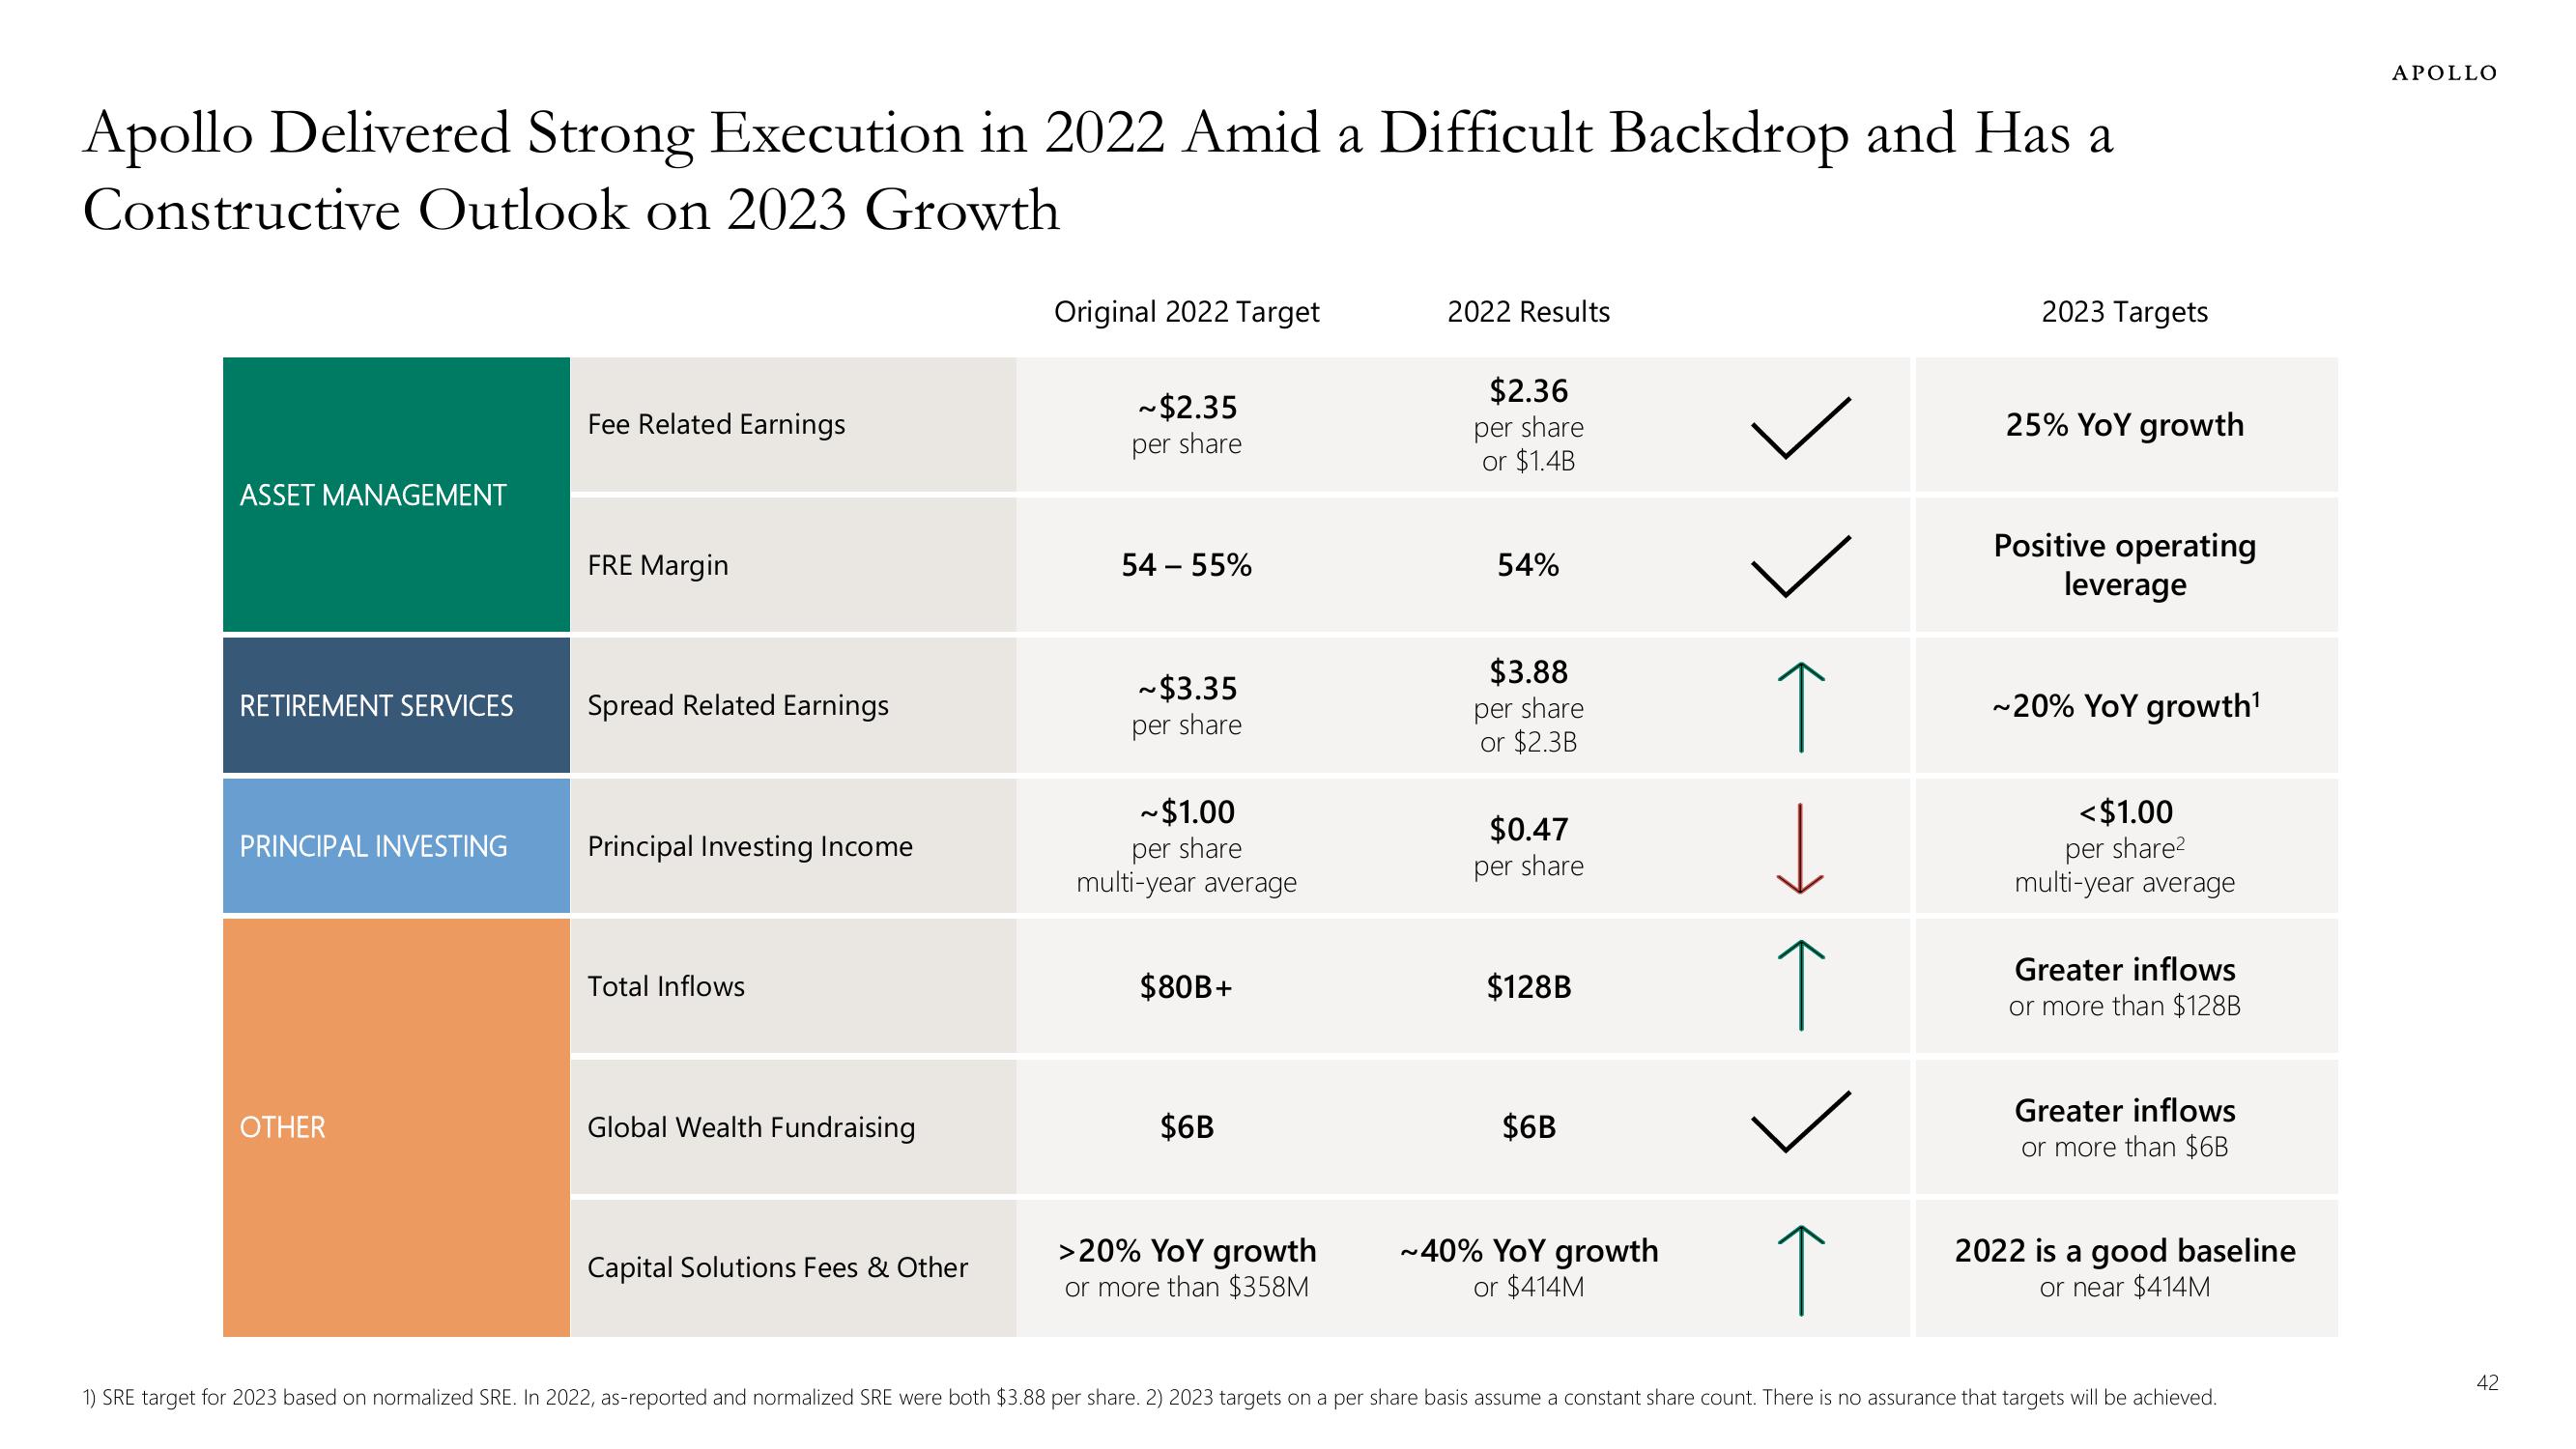
Apollo Delivered Strong Execution in 2022 Amid a Difficult Backdrop and Has a
Constructive Outlook on 2023 Growth
ASSET MANAGEMENT
RETIREMENT SERVICES
PRINCIPAL INVESTING
OTHER
Fee Related Earnings
FRE Margin
Spread Related Earnings
Principal Investing Income
Total Inflows
Global Wealth Fundraising
Capital Solutions Fees & Other
Original 2022 Target
~$2.35
per share
54 - 55%
~$3.35
per share
~$1.00
per share
multi-year average
$80B+
$6B
>20% YoY growth
or more than $358M
2022 Results
$2.36
per share
or $1.4B
54%
$3.88
per share
or $2.3B
$0.47
per share
$128B
$6B
~40% YoY growth
or $414M
↑
-←
↑
2023 Targets
25% YoY growth
Positive operating
leverage
~20% YoY growth¹
<$1.00
per share²
multi-year average
Greater inflows
or more than $128B
Greater inflows
or more than $6B
2022 is a good baseline
or near $414M
1) SRE target for 2023 based on normalized SRE. In 2022, as-reported and normalized SRE were both $3.88 per share. 2) 2023 targets on a per share basis assume a constant share count. There is no assurance that targets will be achieved.
APOLLO
42View entire presentation