Silicon Valley Bank Results Presentation Deck
Non-GAAP reconciliation
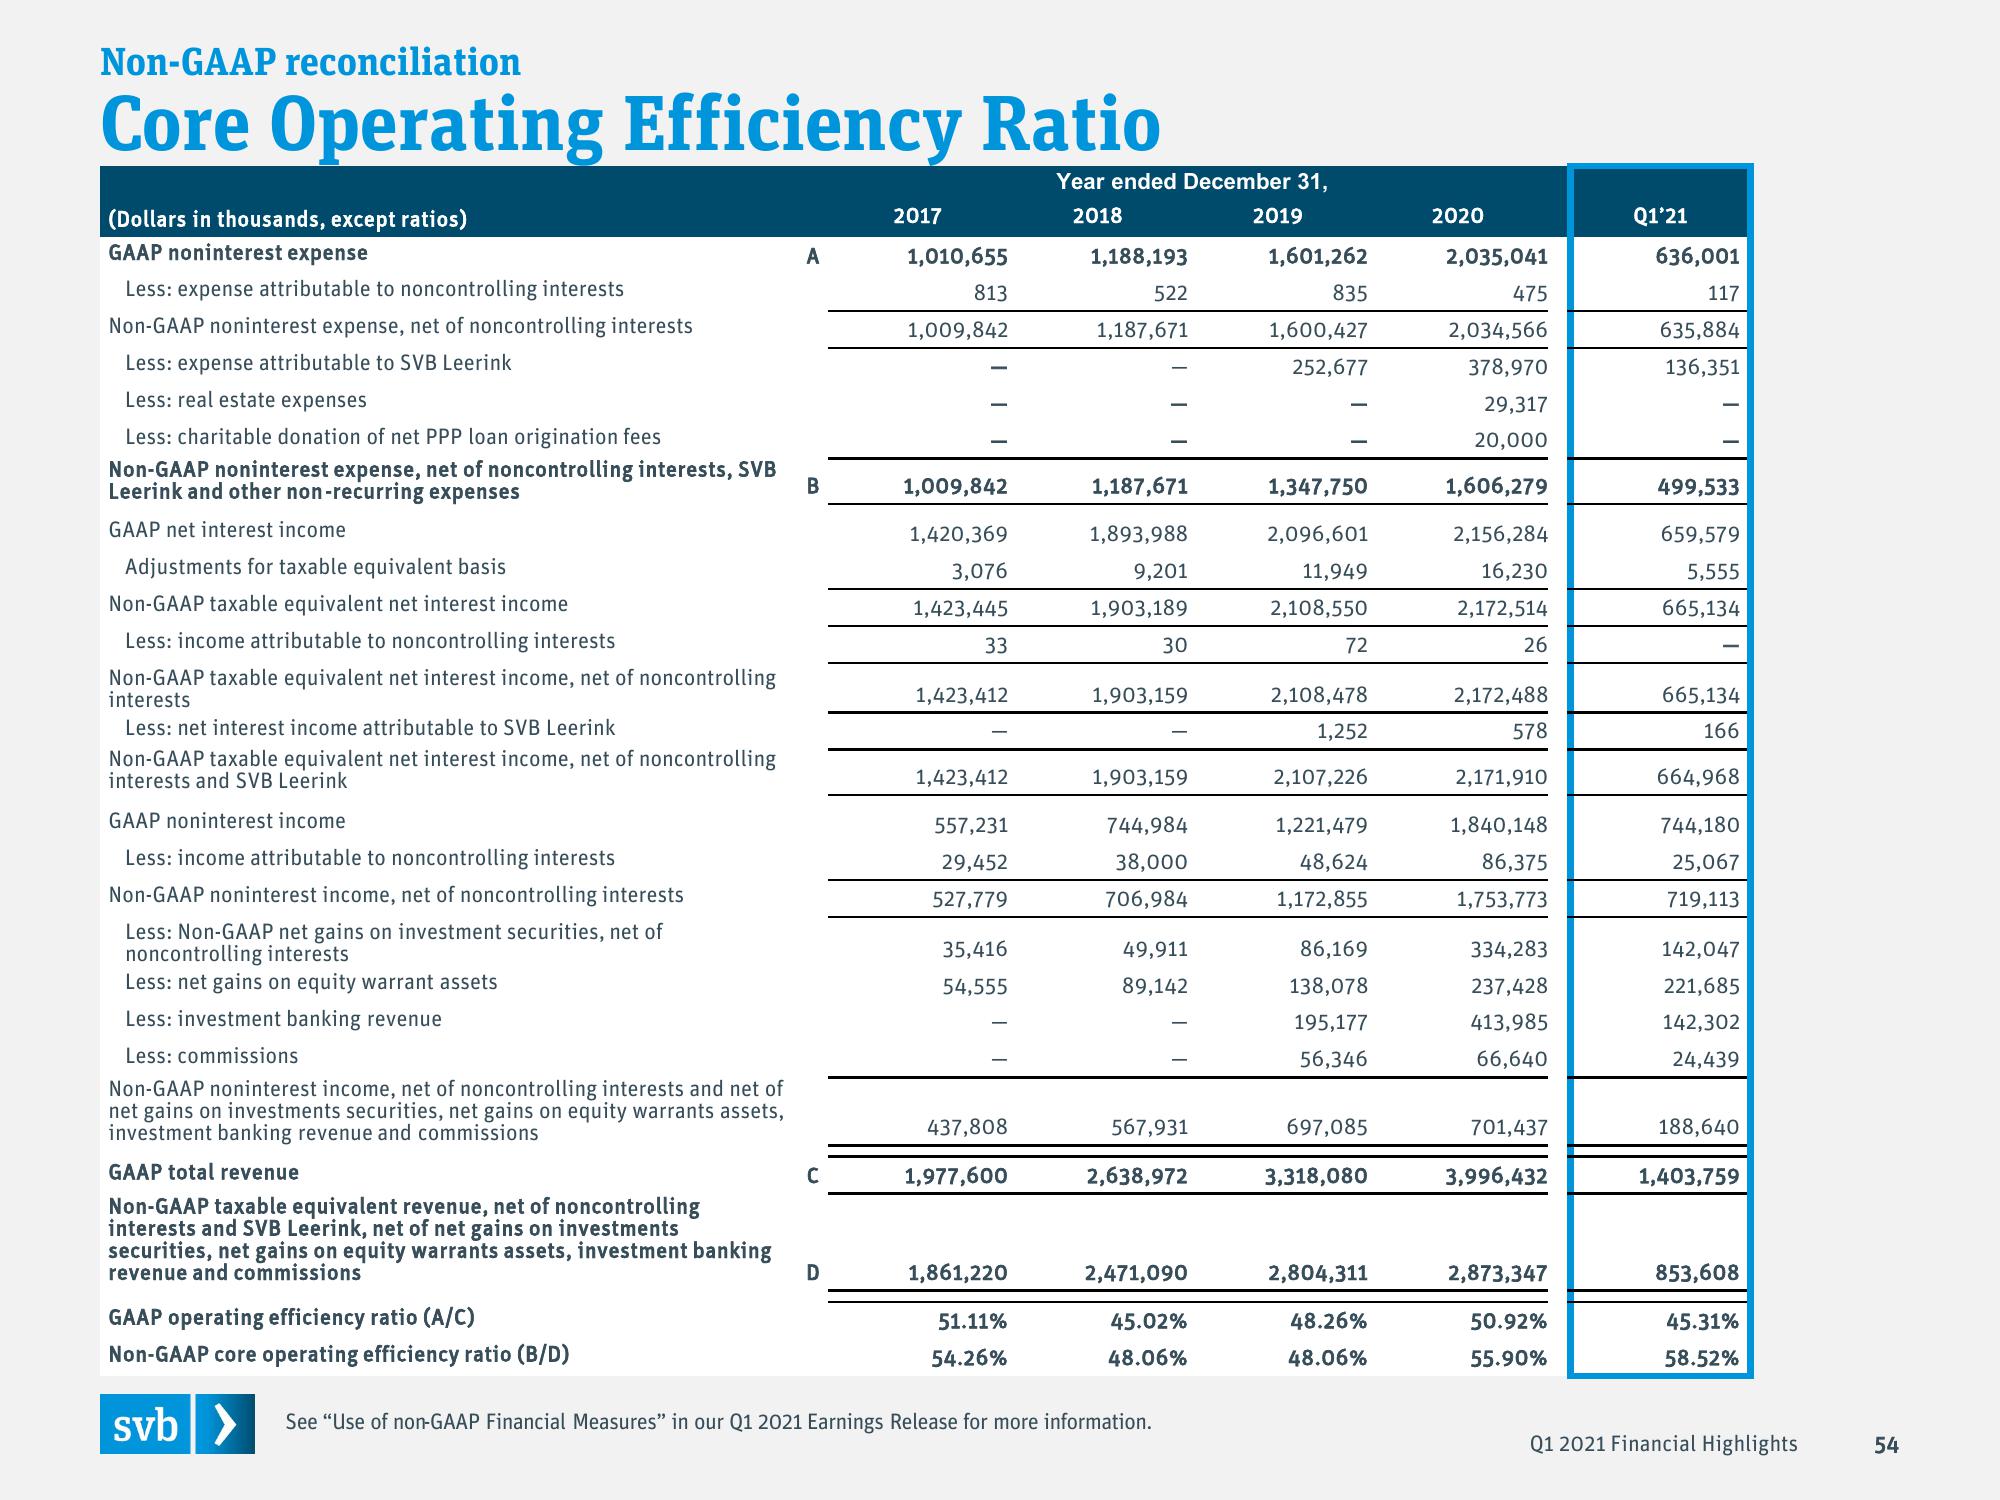
Core Operating Efficiency Ratio
(Dollars in thousands, except ratios)
GAAP noninterest expense
Less: expense attributable to noncontrolling interests
Non-GAAP noninterest expense, net of noncontrolling interests
Less: expense attributable to SVB Leerink
Less: real estate expenses
Less: charitable donation of net PPP loan origination fees
Non-GAAP noninterest expense, net of noncontrolling interests, SVB
Leerink and other non-recurring expenses
GAAP net interest income
Adjustments for taxable equivalent basis
Non-GAAP taxable equivalent net interest income
Less: income attributable to noncontrolling interests
Non-GAAP taxable equivalent net interest income, net of noncontrolling
interests
Less: net interest income attributable to SVB Leerink
Non-GAAP taxable equivalent net interest income, net of noncontrolling
interests and SVB Leerink
GAAP noninterest income
Less: income attributable to noncontrolling interests
Non-GAAP noninterest income, net of noncontrolling interests
Less: Non-GAAP net gains on investment securities, net of
noncontrolling interests
Less: net gains on equity warrant assets
Less: investment banking revenue
Less: commissions
Non-GAAP noninterest income, net of noncontrolling interests and net of
net gains on investments securities, net gains on equity warrants assets,
investment banking revenue and commissions
GAAP total revenue
Non-GAAP taxable equivalent revenue, net of noncontrolling
interests and SVB Leerink, net of net gains on investments
securities, net gains on equity warrants assets, investment banking
revenue and commissions
A
B
с
D
2017
1,010,655
813
1,009,842
1,009,842
1,420,369
3,076
1,423,445
33
1,423,412
1,423,412
557,231
29,452
527,779
35,416
54,555
437,808
1,977,600
1,861,220
51.11%
54.26%
Year ended December 31,
2018
2019
1,188,193
522
1,187,671
1,187,671
1,893,988
9,201
1,903,189
30
1,903,159
1,903,159
744,984
38,000
706,984
49,911
89,142
567,931
2,638,972
GAAP operating efficiency ratio (A/C)
Non-GAAP core operating efficiency ratio (B/D)
svb > See "Use of non-GAAP Financial Measures" in our Q1 2021 Earnings Release for more information.
2,471,090
45.02%
48.06%
1,601,262
835
1,600,427
252,677
1,347,750
2,096,601
11,949
2,108,550
72
2,108,478
1,252
2,107,226
1,221,479
48,624
1,172,855
86,169
138,078
195,177
56,346
697,085
3,318,080
2,804,311
48.26%
48.06%
2020
2,035,041
475
2,034,566
378,970
29,317
20,000
1,606,279
2,156,284
16,230
2,172,514
26
2,172,488
578
2,171,910
1,840,148
86,375
1,753,773
334,283
237,428
413,985
66,640
701,437
3,996,432
2,873,347
50.92%
55.90%
Q1'21
636,001
117
635,884
136,351
499,533
659,579
5,555
665,134
665,134
166
664,968
744,180
25,067
719,113
142,047
221,685
142,302
24,439
188,640
1,403,759
853,608
45.31%
58.52%
Q1 2021 Financial Highlights
54View entire presentation