Silicon Valley Bank Results Presentation Deck
Increased business activity drove core fees higher despite low rate impact on client
investment fees; Expect FY'21 core fees % growth in the mid single digits
FY'21 outlook key drivers
Q1'21 activity
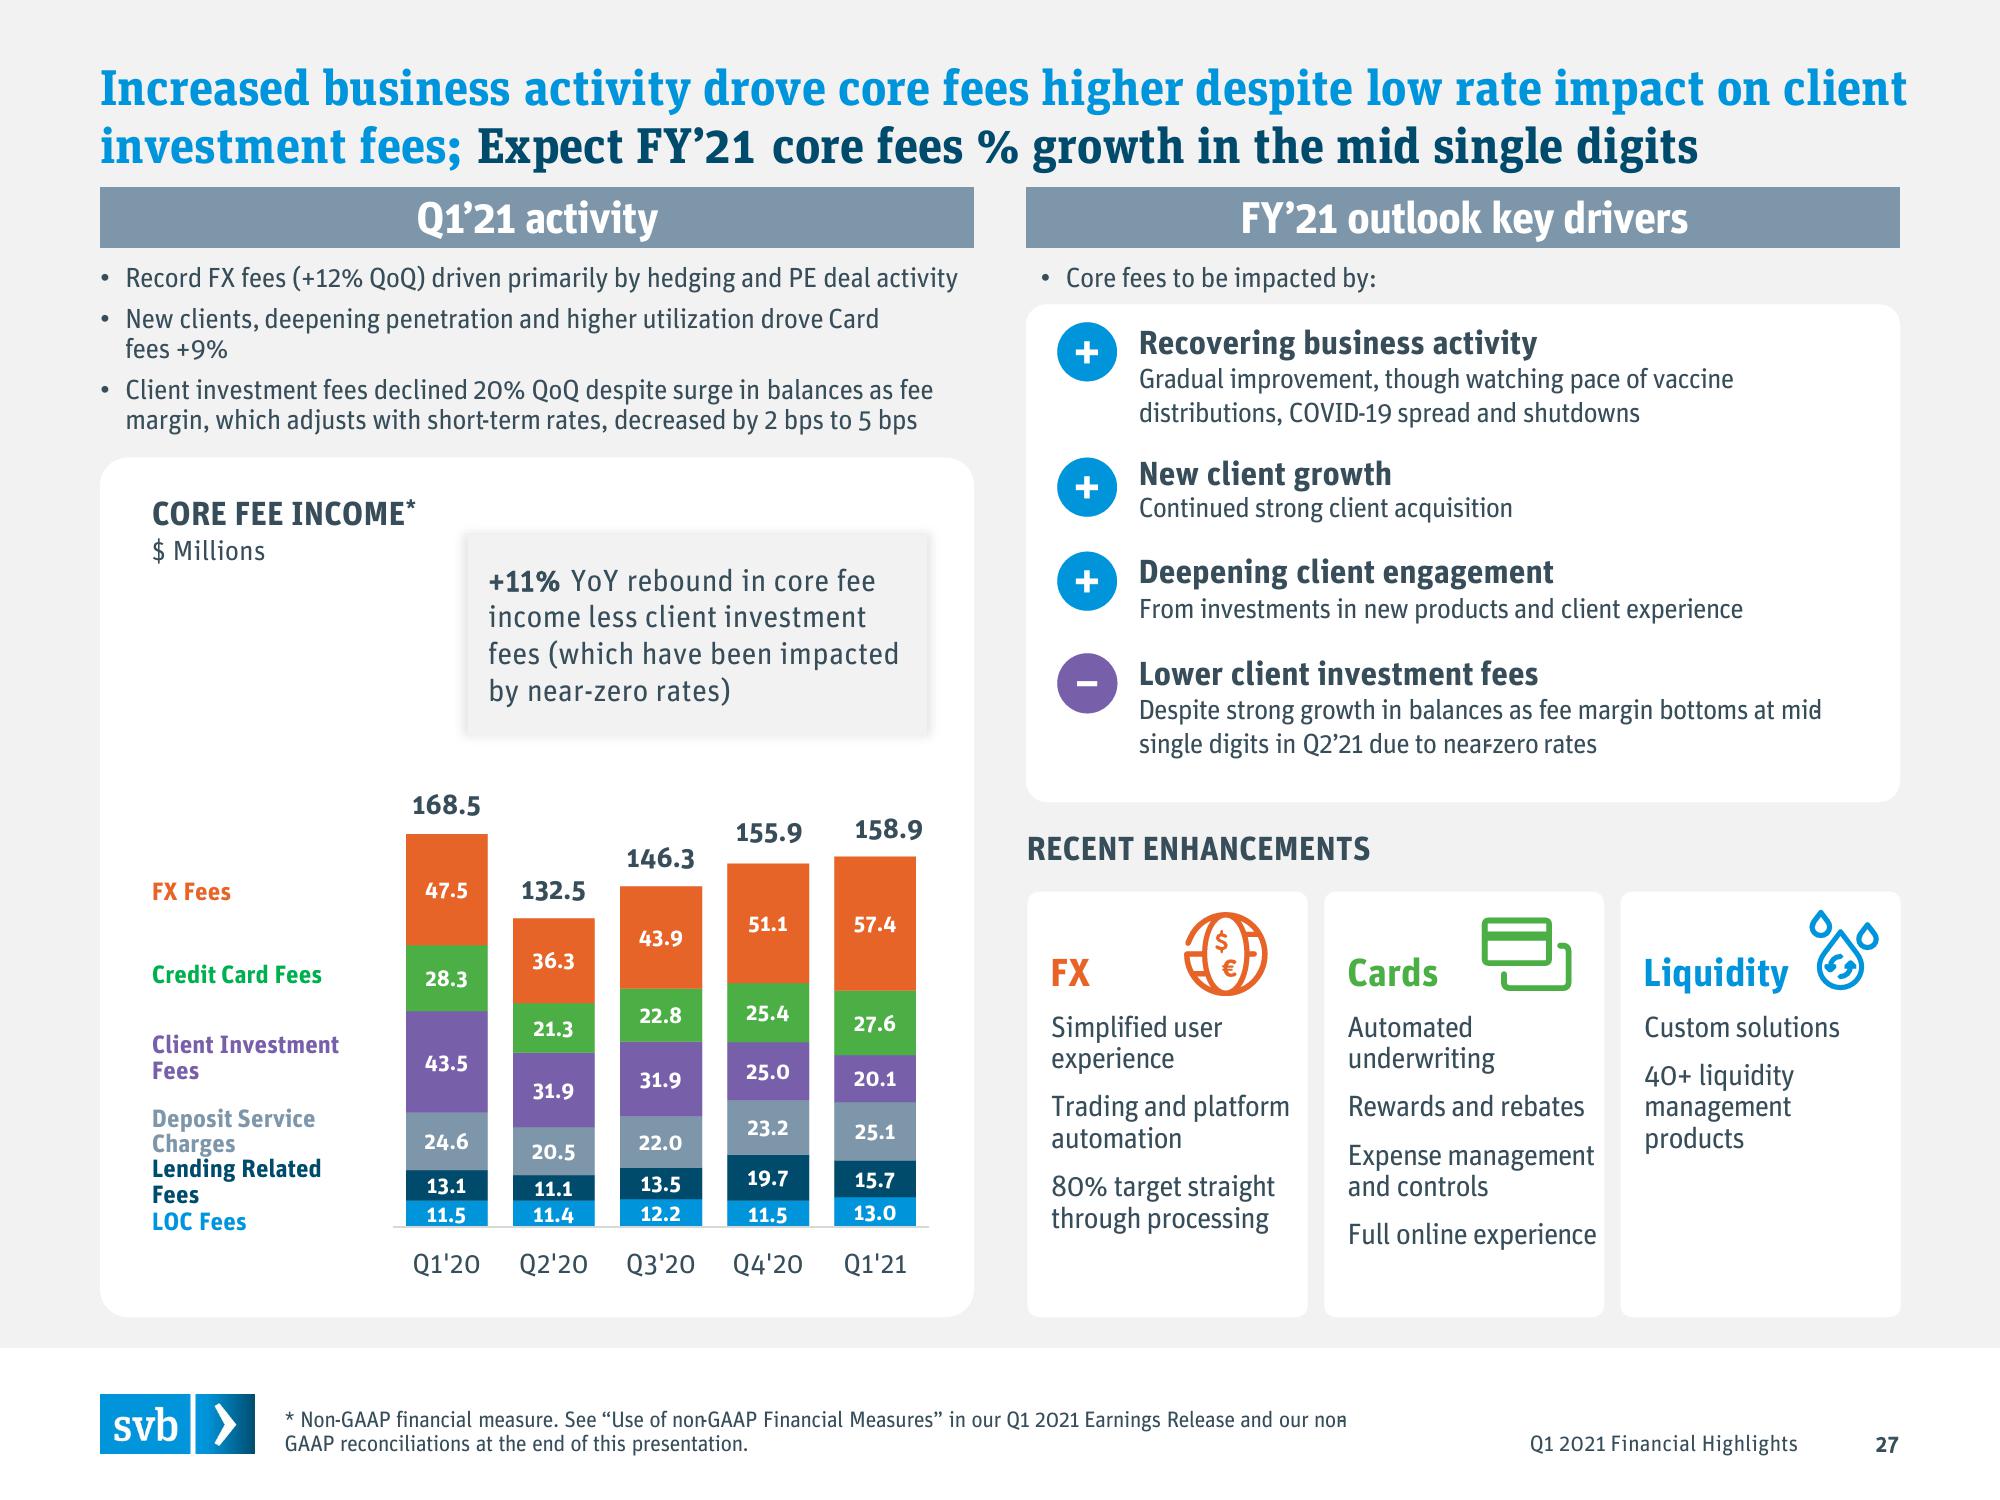
• Record FX fees (+12% QoQ) driven primarily by hedging and PE deal activity
• New clients, deepening penetration and higher utilization drove Card
fees +9%
●
Client investment fees declined 20% QoQ despite surge in balances as fee
margin, which adjusts with short-term rates, decreased by 2 bps to 5 bps
CORE FEE INCOME*
$ Millions
FX Fees
Credit Card Fees
Client Investment
Fees
Deposit Service
Charges
Lending Related
Fees
LOC Fees
svb >
168.5
47.5
28.3
43.5
24.6
13.1
11.5
Q1'20
+11% YoY rebound in core fee
income less client investment
fees (which have been impacted
by near-zero rates)
132.5
36.3
21.3
31.9
20.5
11.1
11.4
146.3
43.9
22.8
31.9
22.0
13.5
12.2
155.9
51.1
25.4
25.0
23.2
19.7
11.5
158.9
57.4
27.6
20.1
25.1
15.7
13.0
Q2'20 Q3'20 Q4'20 Q1'21
●
Core fees to be impacted by:
+Recovering business activity
+
+
Gradual improvement, though watching pace of vaccine
distributions, COVID-19 spread and shutdowns
New client growth
Continued strong client acquisition
Deepening client engagement
From investments in new products and client experience
Lower client investment fees
Despite strong growth in balances as fee margin bottoms at mid
single digits in Q2'21 due to nea-zero rates
RECENT ENHANCEMENTS
FX
Simplified user
experience
Trading and platform
automation
80% target straight
through processing
Cards
Automated
underwriting
Rewards and rebates
Expense management
and controls
Full online experience
* Non-GAAP financial measure. See "Use of non-GAAP Financial Measures" in our Q1 2021 Earnings Release and our non
GAAP reconciliations at the end of this presentation.
Liquidity
Custom solutions
40+ liquidity
management
products
Q1 2021 Financial Highlights
27View entire presentation