Silicon Valley Bank Results Presentation Deck
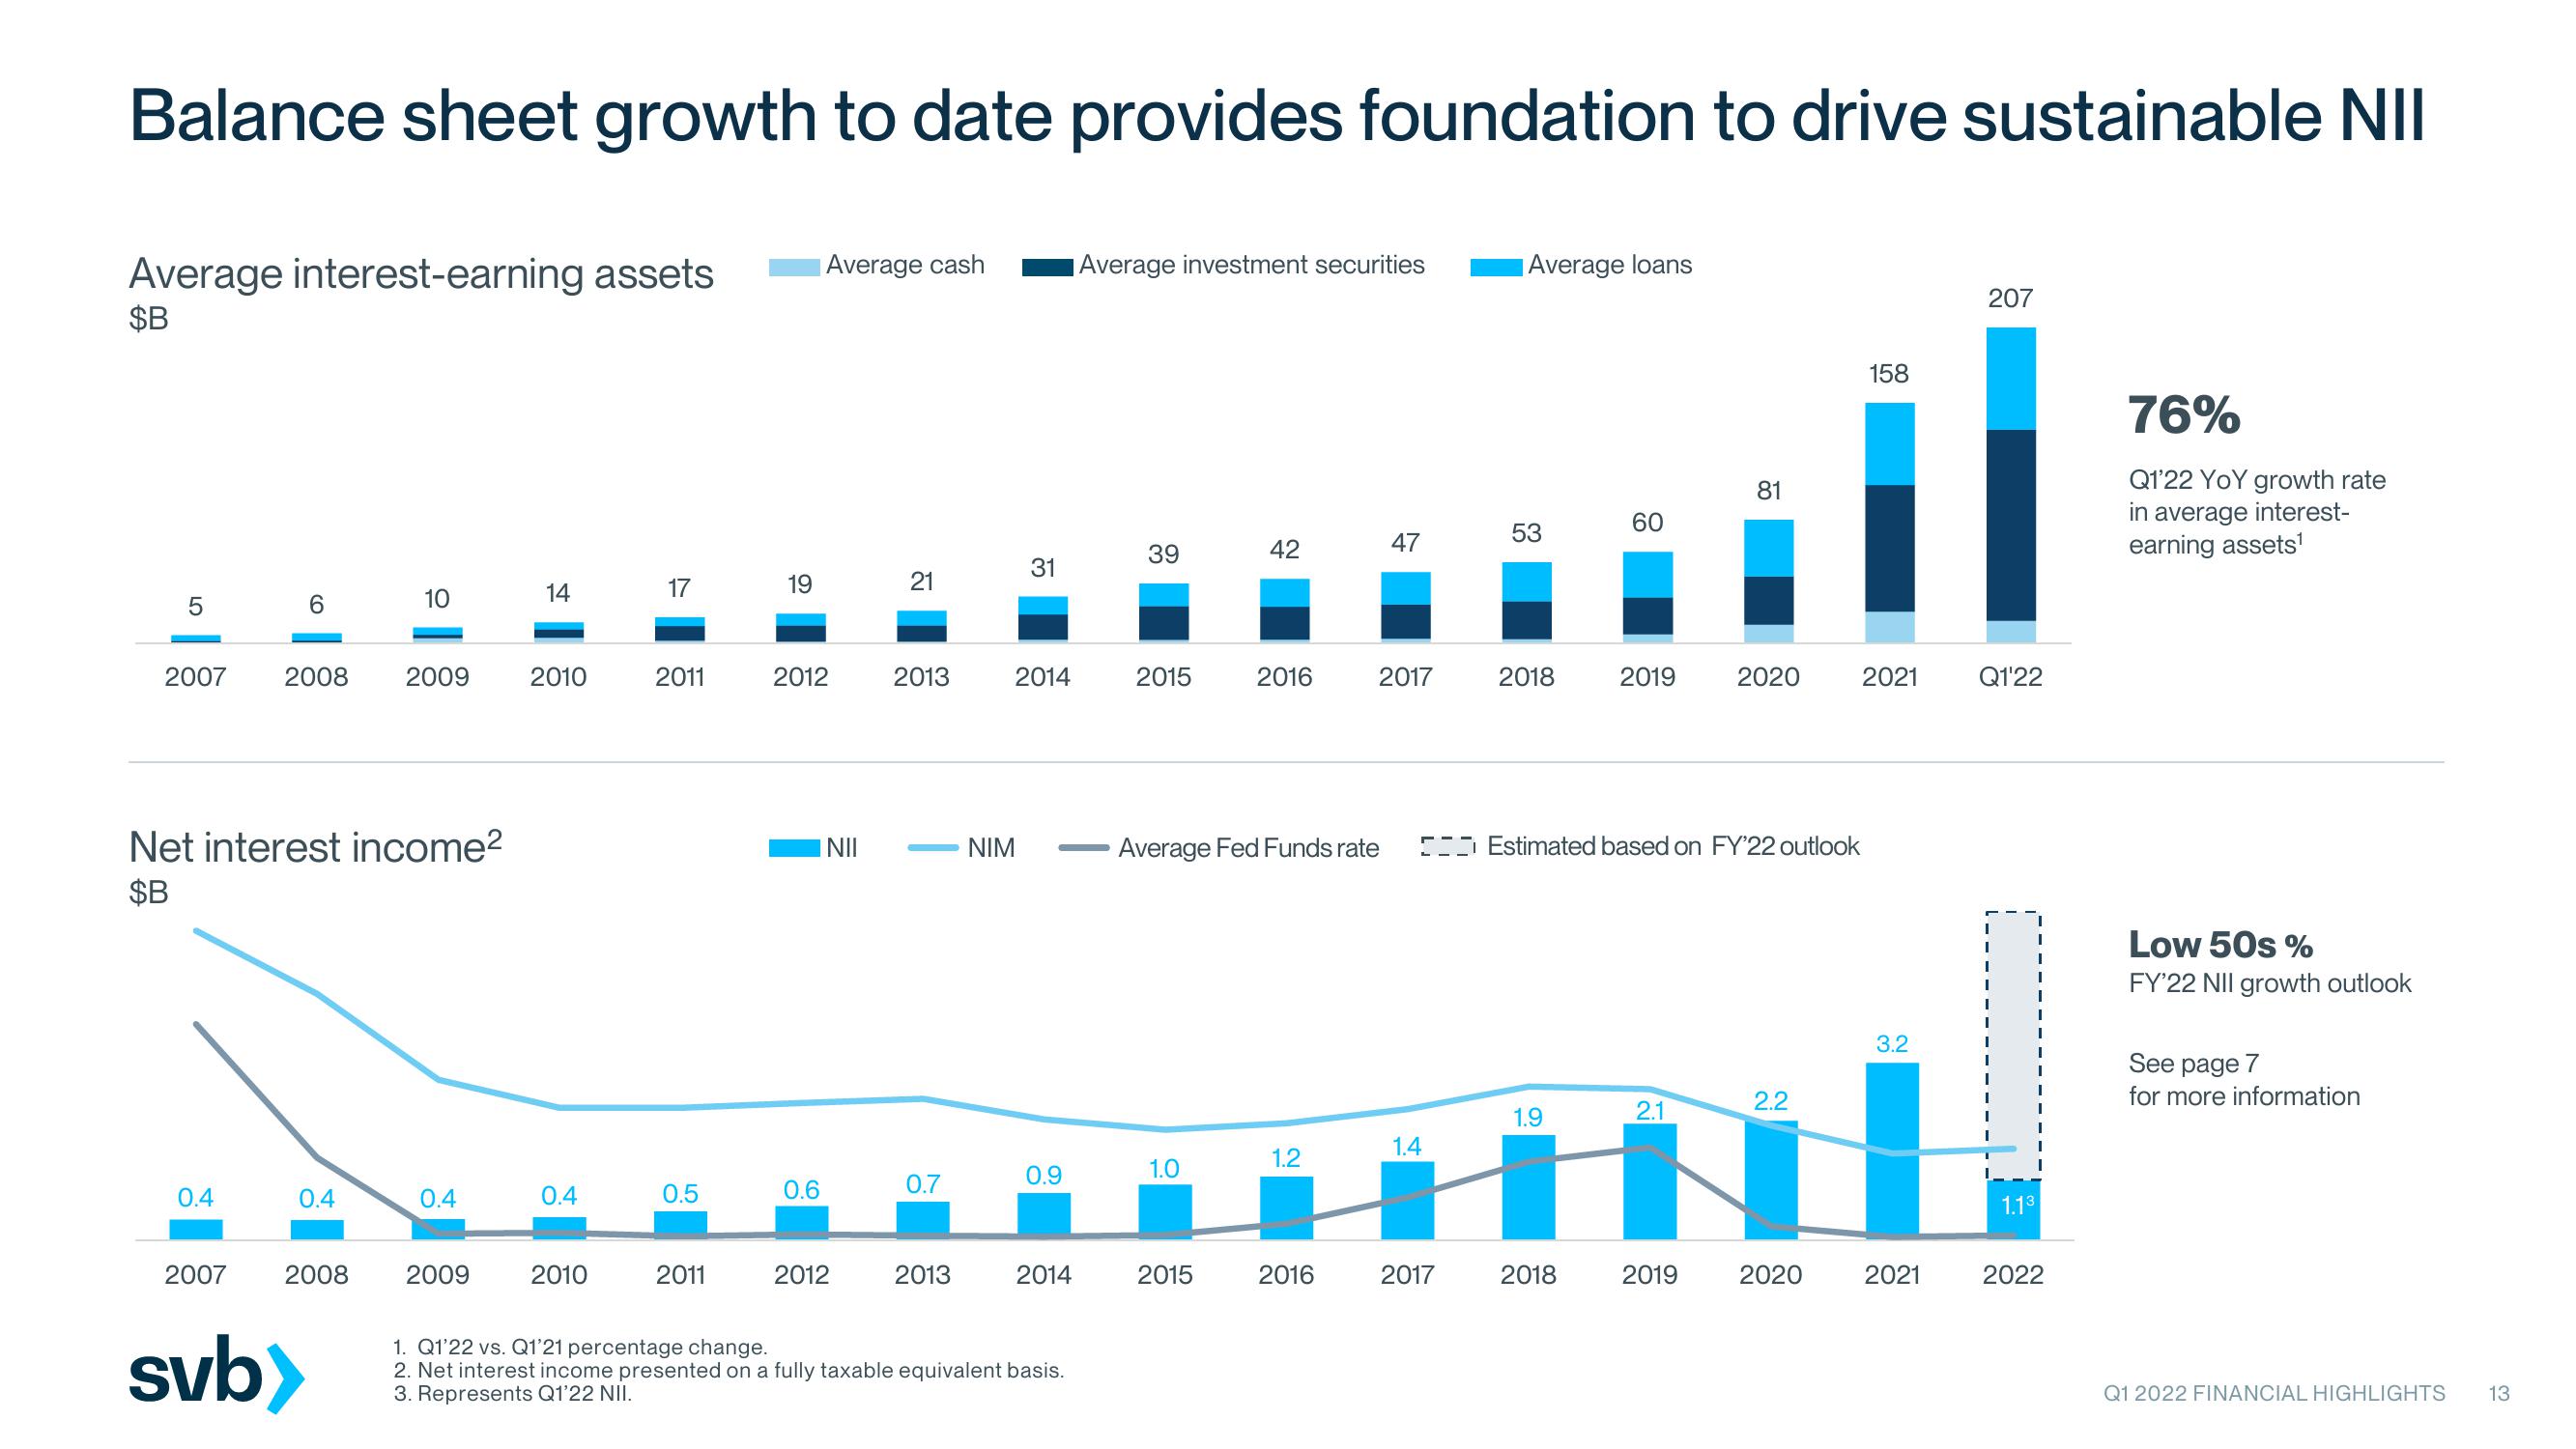
Balance sheet growth to date provides foundation to drive sustainable NII
Average interest-earning assets Average cash
$B
5
2007 2008 2009
0.4
6
Net interest income²
$B
2007
0.4
10
2008
svb>
0.4
2009
14
2010
0.4
2010
17
2011
0.5
2011
19
2012
0.6
NII
2012
21
2013
0.7
2013
NIM
31
2014
0.9
2014
1. Q1'22 vs. Q1'21 percentage change.
2. Net interest income presented on a fully taxable equivalent basis.
3. Represents Q1'22 NII.
Average investment securities
39
2015
1.0
42
2015
2016
Average Fed Funds rate
1.2
2016
47
2017
1.4
2017
Average loans
53
2018
60
1.9
2019
2018
Estimated based on FY'22 outlook
2.1
IN
2019
81
2020
2.2
2020
158
2021
3.2
2021
207
Q1'22
1.13
2022
76%
Q1'22 YoY growth rate
in average interest-
earning assets¹
Low 50s%
FY'22 NII growth outlook
See page 7
for more information
Q1 2022 FINANCIAL HIGHLIGHTS
13View entire presentation