Silicon Valley Bank Results Presentation Deck
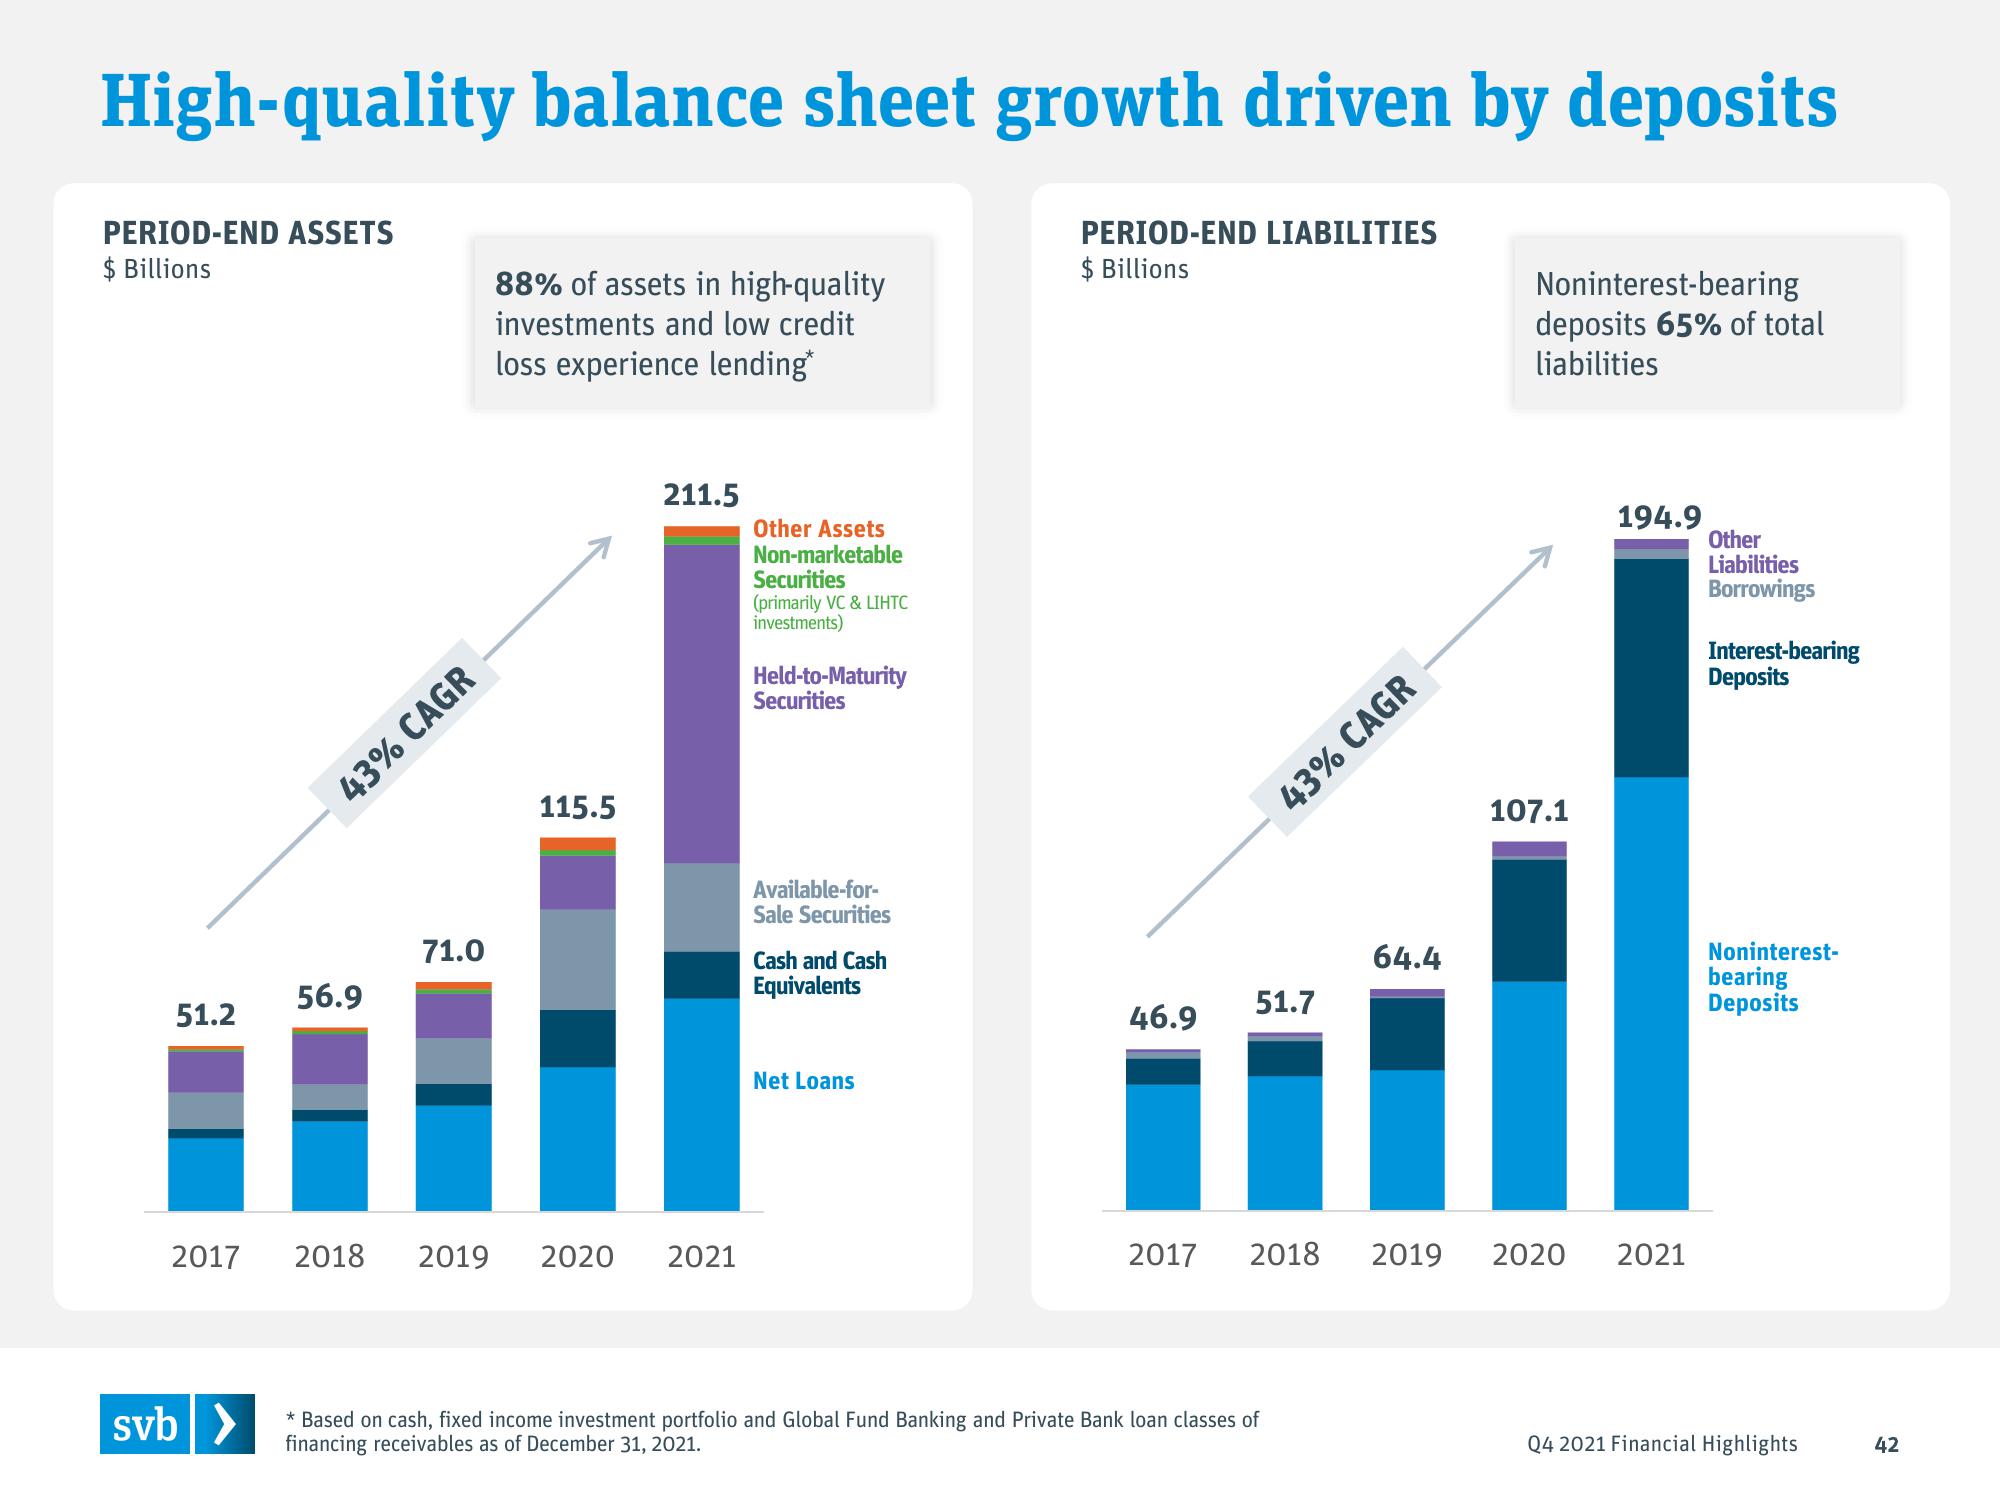
High-quality balance sheet growth driven by deposits
PERIOD-END ASSETS
$ Billions
PERIOD-END LIABILITIES
$ Billions
51.2
2017
svb >
43% CAGR
56.9
88% of assets in high-quality
investments and low credit
loss experience lending*
71.0
115.5
211.5
2018 2019 2020 2021
Other Assets
Non-marketable
Securities
(primarily VC & LIHTC
investments)
Held-to-Maturity
Securities
Available-for-
Sale Securities
Cash and Cash
Equivalents
Net Loans
46.9
2017
43% CAGR
51.7
2018
* Based on cash, fixed income investment portfolio and Global Fund Banking and Private Bank loan classes of
financing receivables as of December 31, 2021.
64.4
Noninterest-bearing
deposits 65% of total
liabilities
107.1
194.9
2019 2020 2021
Other
Liabilities
Borrowings
Interest-bearing
Deposits
Noninterest-
bearing
Deposits
Q4 2021 Financial Highlights
42View entire presentation