Silicon Valley Bank Results Presentation Deck
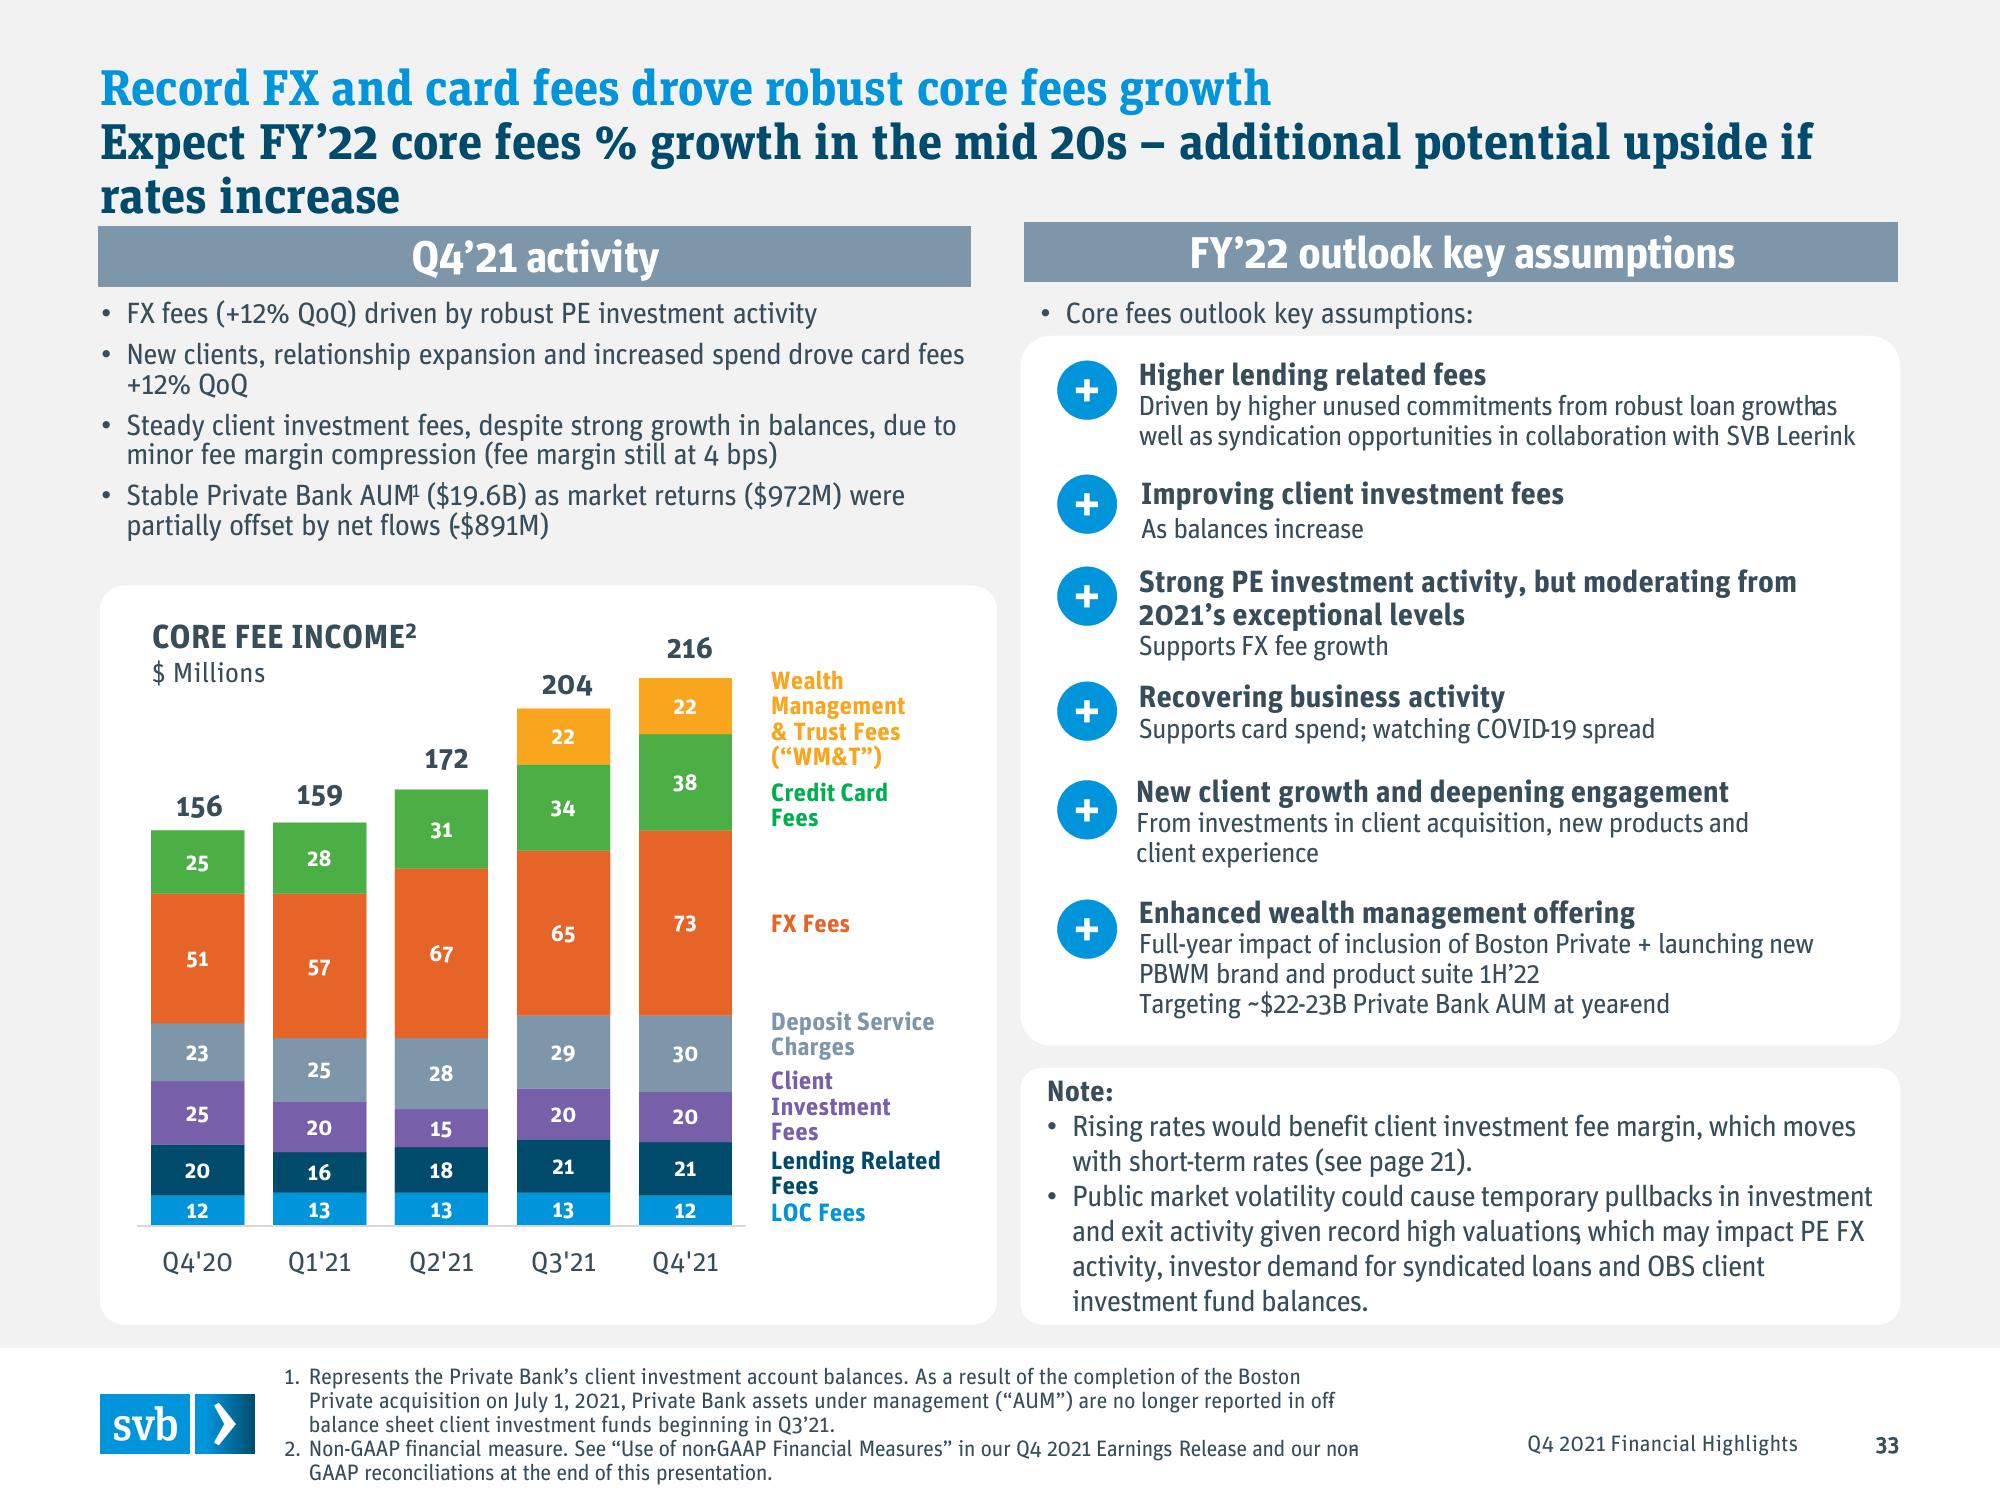
Record FX and card fees drove robust core fees growth
Expect FY'22 core fees % growth in the mid 20s - additional potential upside if
rates increase
Q4'21 activity
FX fees (+12% QoQ) driven by robust PE investment activity
• New clients, relationship expansion and increased spend drove card fees
+12% QOQ
●
●
●
Steady client investment fees, despite strong growth in balances, due to
minor fee margin compression (fee margin still at 4 bps)
Stable Private Bank AUM¹ ($19.6B) as market returns ($972M) were
partially offset by net flows ($891M)
CORE FEE INCOME²
$ Millions
156
25
51
23
25
20
12
Q4'20
svb >
159
28
57
25
20
16
13
Q1'21
172
31
67
28
15
18
13
Q2'21
204
22
34
65
29
20
21
13
Q3'21
216
22
38
73
30
20
21
12
Q4'21
Wealth
Management
& Trust Fees
("WM&T")
Credit Card
Fees
FX Fees
Deposit Service
Charges
Client
Investment
Fees
Lending Related
Fees
LOC Fees
●
Core fees outlook key assumptions:
+
+
+
+
FY'22 outlook key assumptions
+
Higher lending related fees
Driven by higher unused commitments from robust loan growthas
well as syndication opportunities in collaboration with SVB Leerink
Improving client investment fees
As balances increase
Strong PE investment activity, but moderating from
2021's exceptional levels
Supports FX fee growth
Recovering business activity
Supports card spend; watching COVID-19 spread
New client growth and deepening engagement
From investments in client acquisition, new products and
client experience
Enhanced wealth management offering
Full-year impact of inclusion of Boston Private + launching new
PBWM brand and product suite 1H'22
Targeting -$22-23B Private Bank AUM at yearend
Note:
Rising rates would benefit client investment fee margin, which moves
with short-term rates (see page 21).
Public market volatility could cause temporary pullbacks in investment
and exit activity given record high valuations which may impact PE FX
activity, investor demand for syndicated loans and OBS client
investment fund balances.
1. Represents the Private Bank's client investment account balances. As a result of the completion of the Boston
Private acquisition on July 1, 2021, Private Bank assets under management ("AUM") are no longer reported in off
balance sheet client investment funds beginning in Q3'21.
2. Non-GAAP financial measure. See "Use of non-GAAP Financial Measures" in our Q4 2021 Earnings Release and our non
GAAP reconciliations at the end of this presentation.
Q4 2021 Financial Highlights
33View entire presentation