BAT Results Presentation Deck
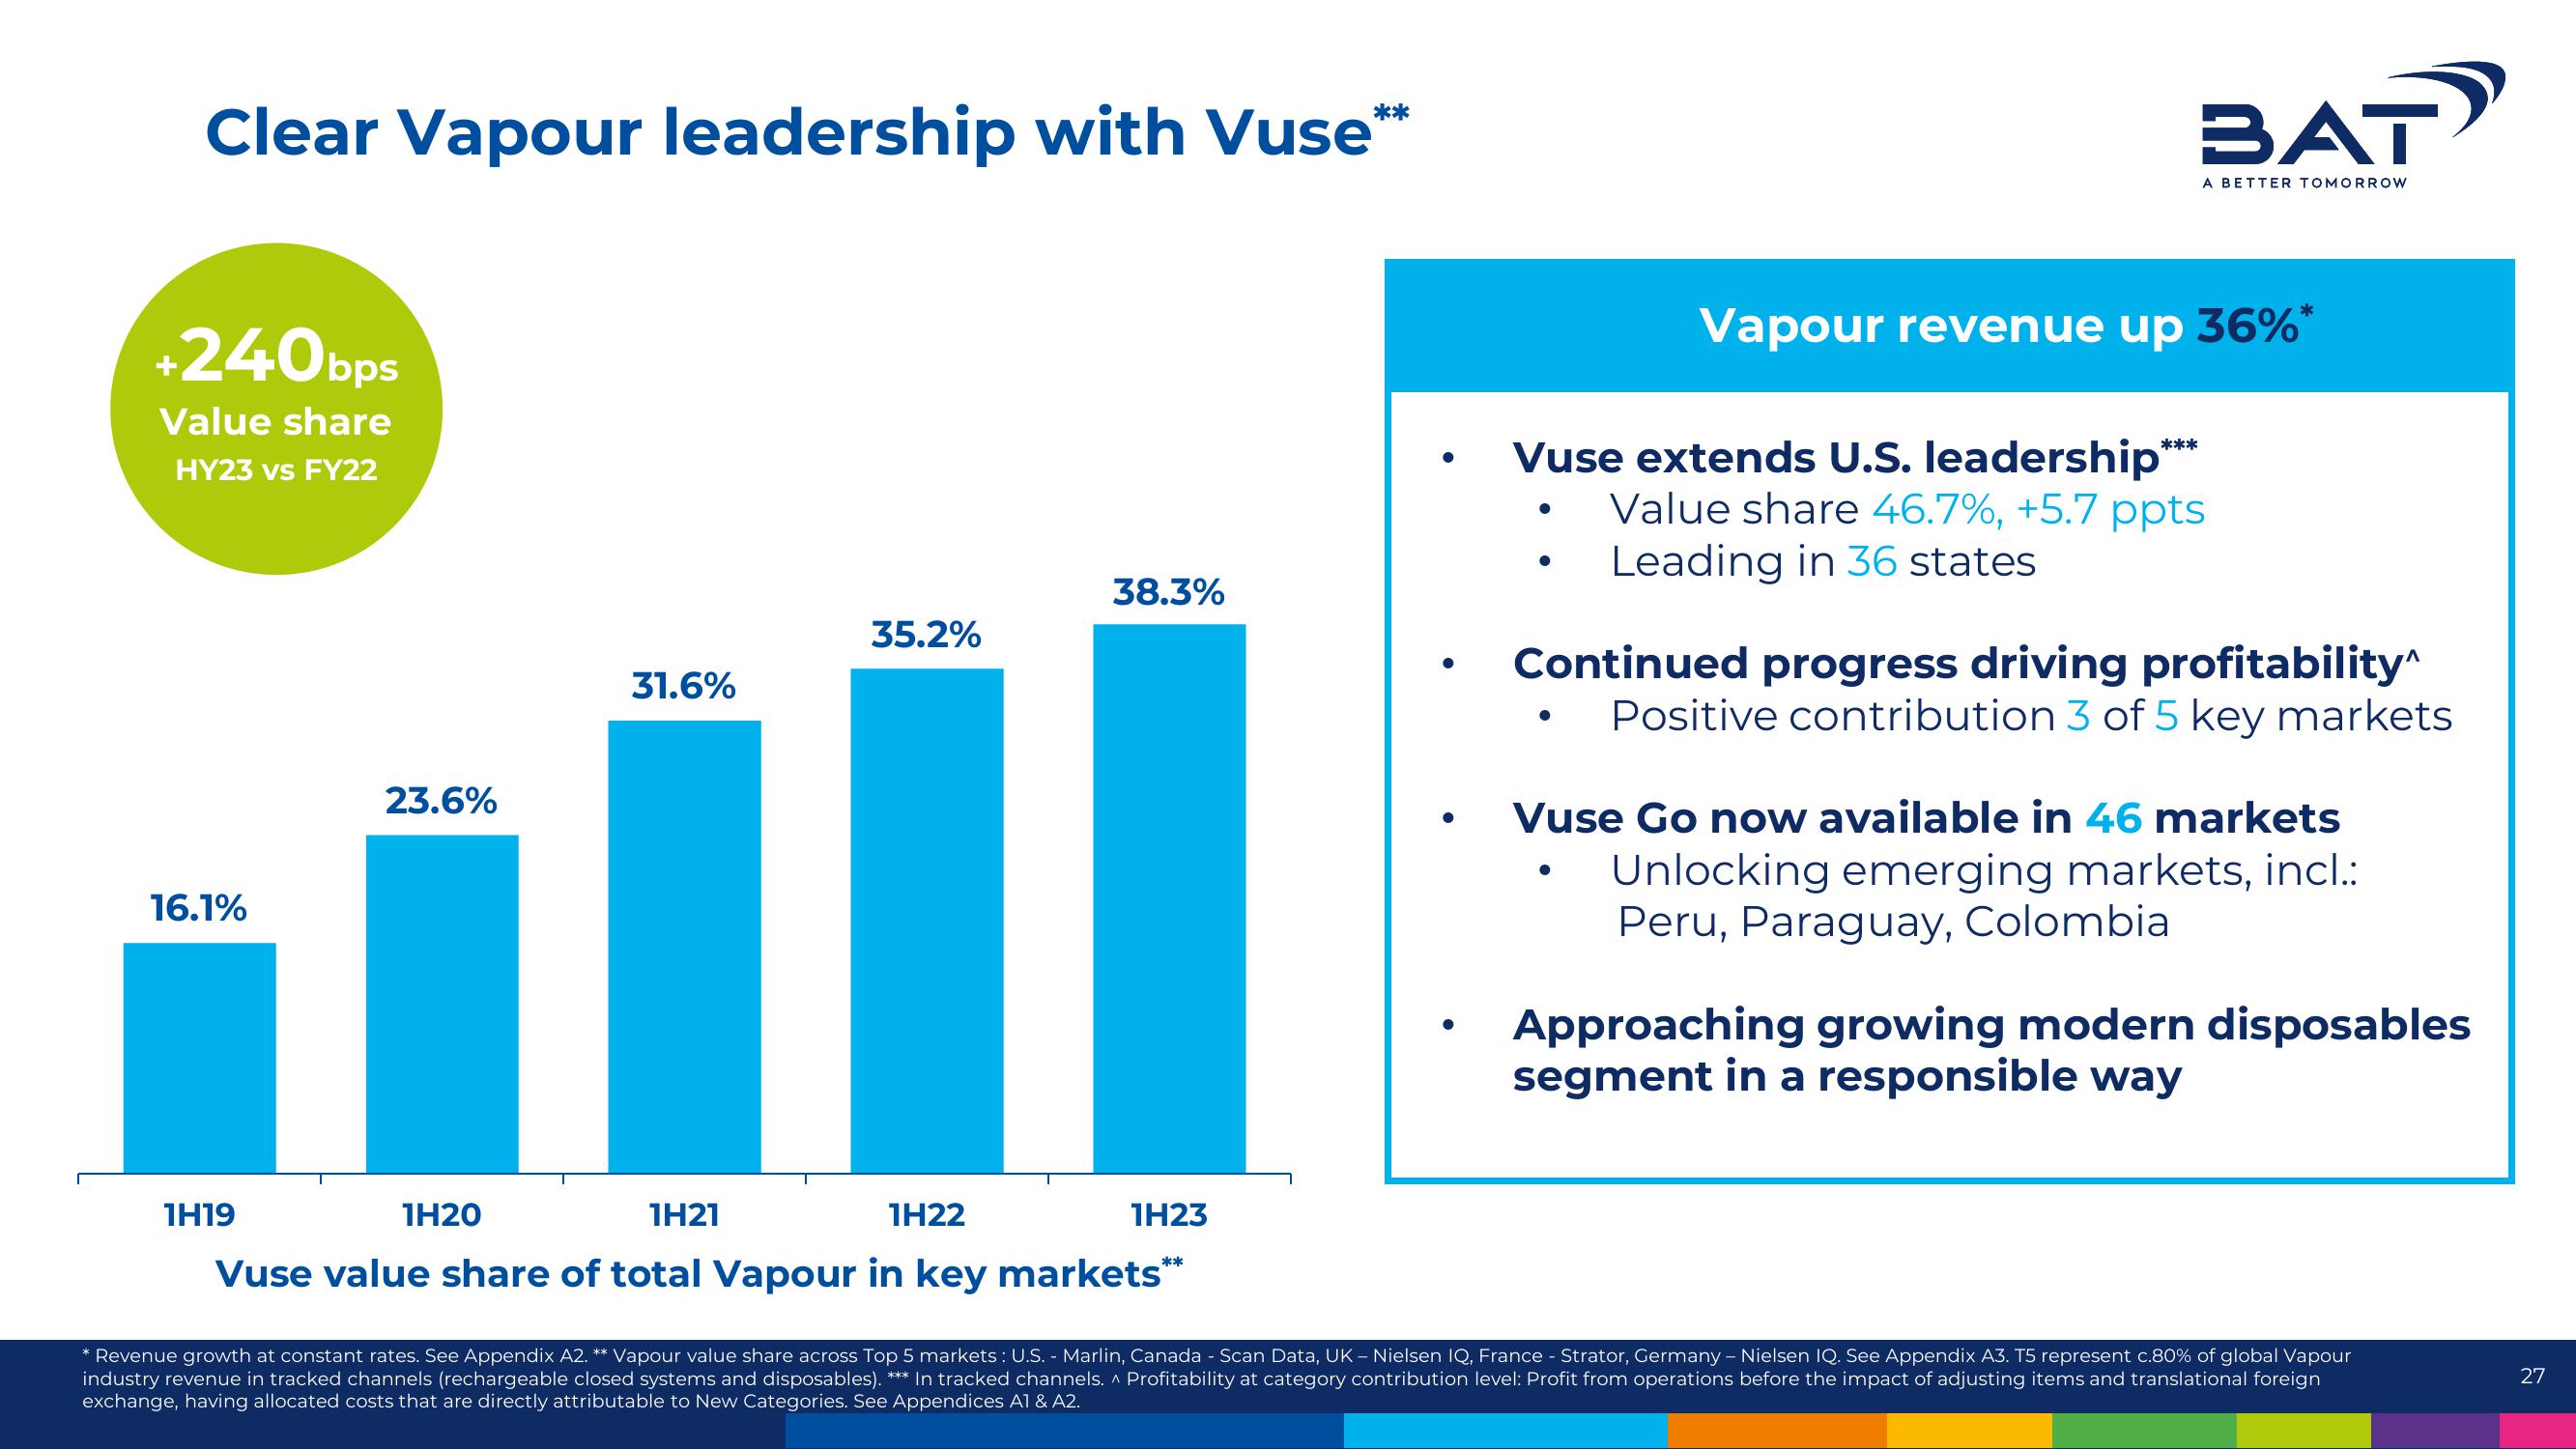
Clear Vapour leadership with Vuse***
+240bps
Value share
HY23 vs FY22
16.1%
23.6%
1H19
31.6%
1H20
35.2%
1H21
1H22
Vuse value share of total Vapour in key markets**
38.3%
1H23
●
●
●
●
●
BAT
A BETTER TOMORROW
Vuse extends U.S. leadership
Value share 46.7%, +5.7 ppts
Leading in 36 states
Vapour revenue up 36%*
●
***
Continued progress driving profitability^
Positive contribution 3 of 5 key markets
Vuse Go now available in 46 markets
Unlocking emerging markets, incl.:
Peru, Paraguay, Colombia
Approaching growing modern disposables
segment in a responsible way
* Revenue growth at constant rates. See Appendix A2. ** Vapour value share across Top 5 markets: U.S. - Marlin, Canada - Scan Data, UK - Nielsen IQ, France - Strator, Germany - Nielsen IQ. See Appendix A3. T5 represent c.80% of global Vapour
industry revenue in tracked channels (rechargeable closed systems and disposables). *** In tracked channels. ^ Profitability at category contribution level: Profit from operations before the impact of adjusting items and translational foreign
exchange, having allocated costs that are directly attributable to New Categories. See Appendices A1 & A2.
27View entire presentation