AstraZeneca Results Presentation Deck
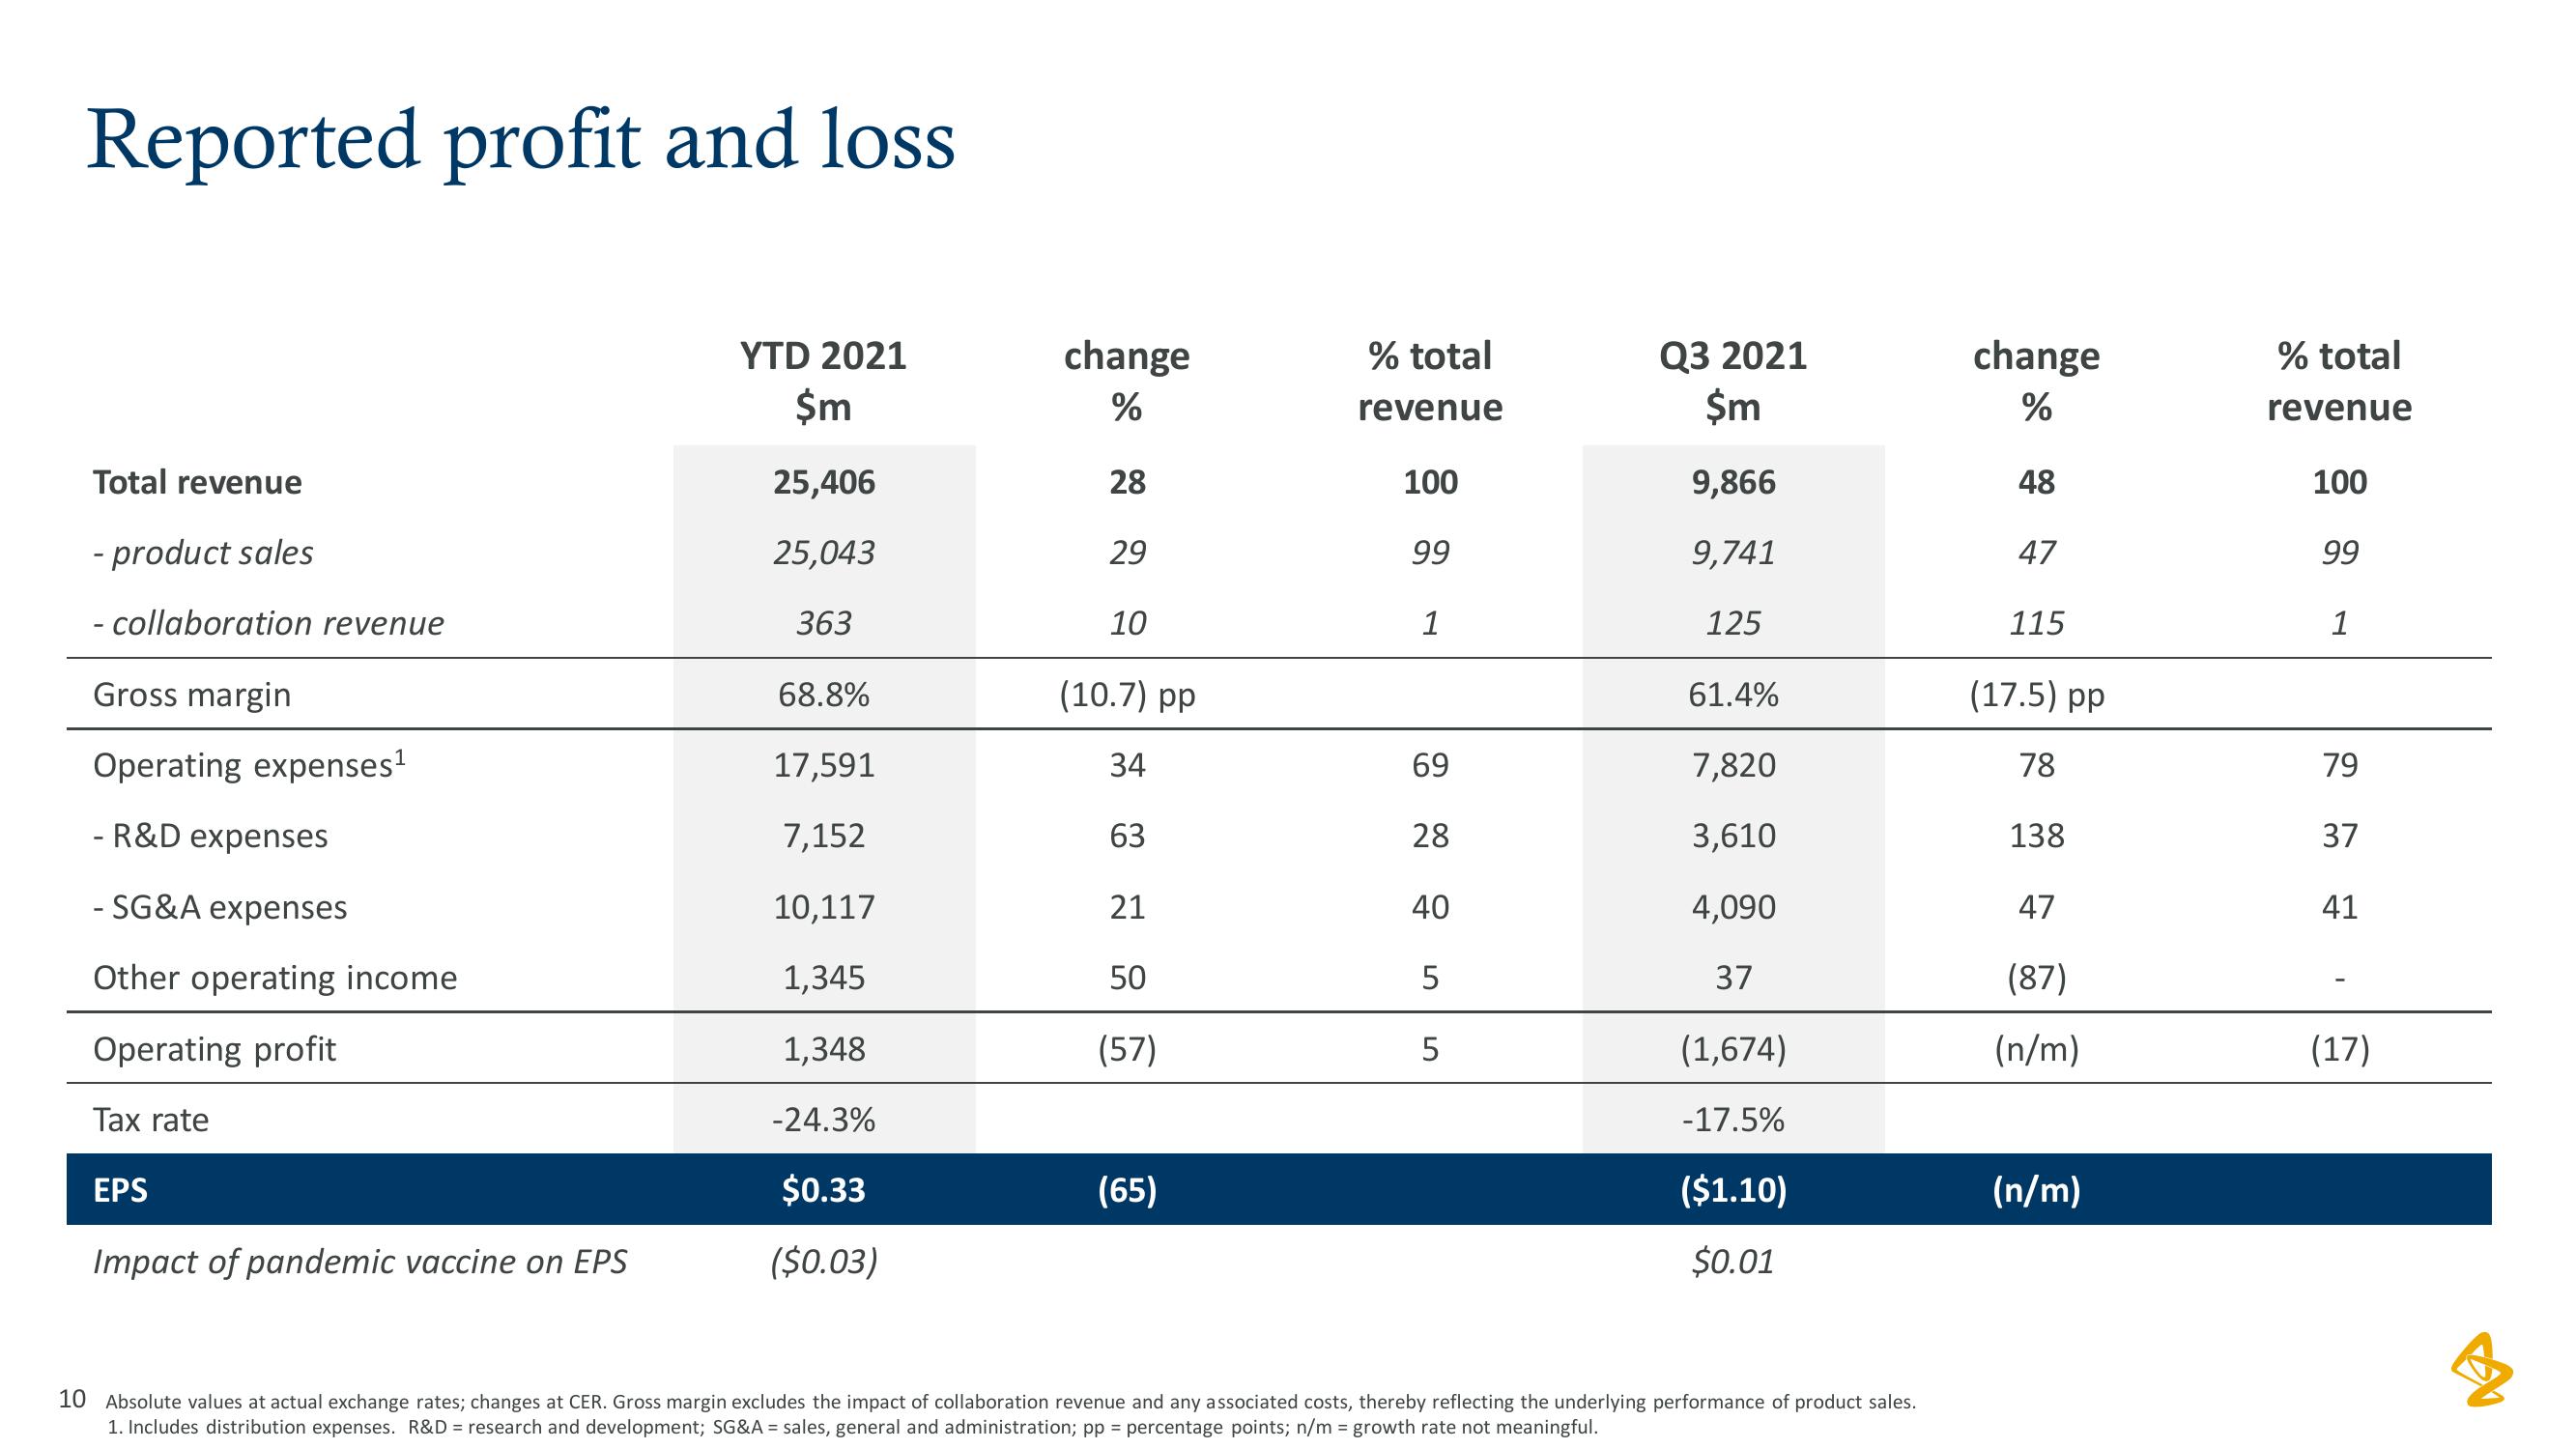
Reported profit and loss
Total revenue
- product sales
- collaboration revenue
Gross margin
Operating expenses ¹
- R&D expenses
- SG&A expenses
Other operating income
Operating profit
Tax rate
EPS
Impact of pandemic vaccine on EPS
YTD 2021
$m
25,406
25,043
363
68.8%
17,591
7,152
10,117
1,345
1,348
-24.3%
$0.33
($0.03)
change
%
28
29
10
(10.7) pp
34
63
21
50
(57)
(65)
% total
revenue
100
99
1
69
28
40
5
LO
5
Q3 2021
$m
9,866
9,741
125
61.4%
7,820
3,610
4,090
37
(1,674)
-17.5%
($1.10)
$0.01
10 Absolute values at actual exchange rates; changes at CER. Gross margin excludes the impact of collaboration revenue and any associated costs, thereby reflecting the underlying performance of product sales.
1. Includes distribution expenses. R&D = research and development; SG&A= sales, general and administration; pp = percentage points; n/m = growth rate not meaningful.
change
%
48
47
115
(17.5) pp
78
138
47
(87)
(n/m)
(n/m)
% total
revenue
100
99
1
79
37
41
(17)
4View entire presentation