Silicon Valley Bank Results Presentation Deck
Non-GAAP reconciliation
Non-marketable and other equity securities and tangible common
equity
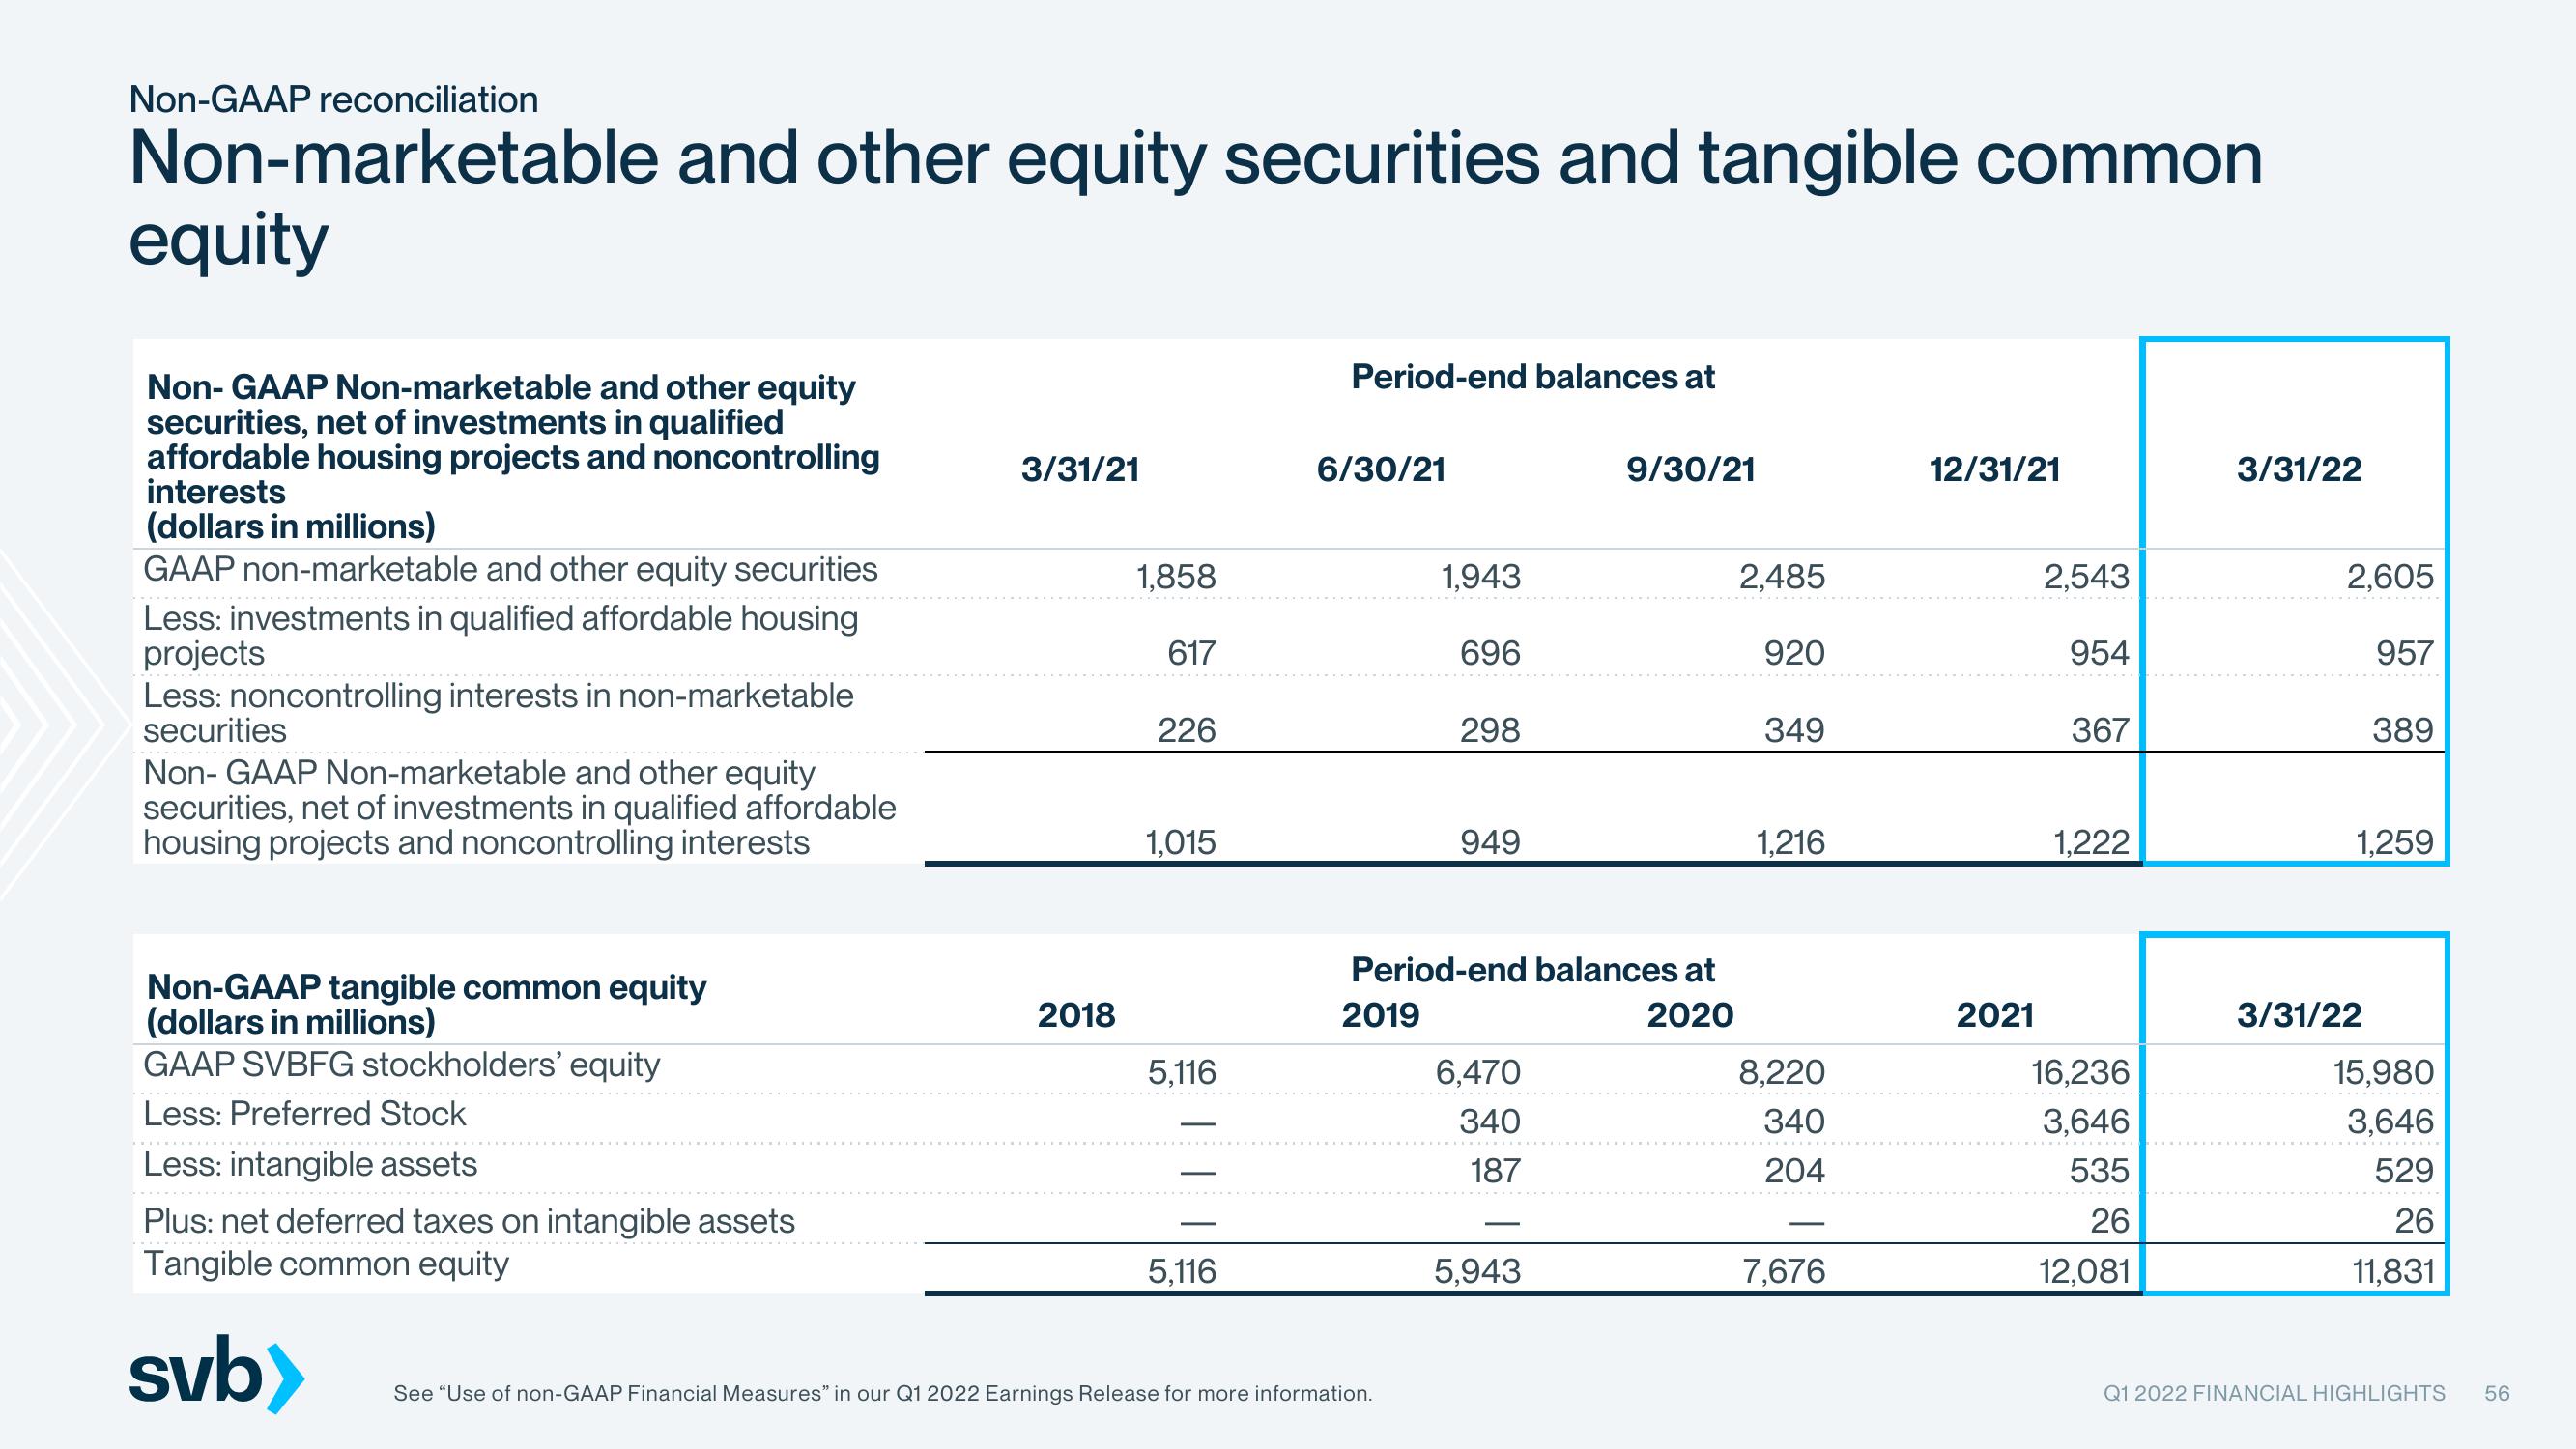
Non- GAAP Non-marketable and other equity
securities, net of investments in qualified
affordable housing projects and noncontrolling
interests
(dollars in millions)
GAAP non-marketable and other equity securities
Less: investments in qualified affordable housing
projects
Less: noncontrolling interests in non-marketable
securities
Non- GAAP Non-marketable and other equity
securities, net of investments in qualified affordable
housing projects and noncontrolling interests
Non-GAAP tangible common equity
(dollars in millions)
GAAP SVBFG stockholders' equity
Less: Preferred Stock
Less: intangible assets
Plus: net deferred taxes on intangible assets
Tangible common equity
svb>
3/31/21
2018
1,858
617
226
1,015
5,116
5,116
Period-end balances at
6/30/21
1,943
See "Use of non-GAAP Financial Measures" in our Q1 2022 Earnings Release for more information.
696
298
949
Period-end balances at
2019
2020
6,470
340
187
9/30/21
5,943
2,485
920
349
1,216
8,220
340
204
7,676
12/31/21
2021
2,543
954
367
1,222
16,236
3,646
535
26
12,081
3/31/22
2,605
957
3/31/22
389
1,259
15,980
3,646
529
26
11,831
Q1 2022 FINANCIAL HIGHLIGHTS 56View entire presentation