Silicon Valley Bank Results Presentation Deck
Excellent credit performance - strong loan growth drove higher provision
Improved FY'22 NCOs outlook to 15-35 bps
●
Q4'21 activity
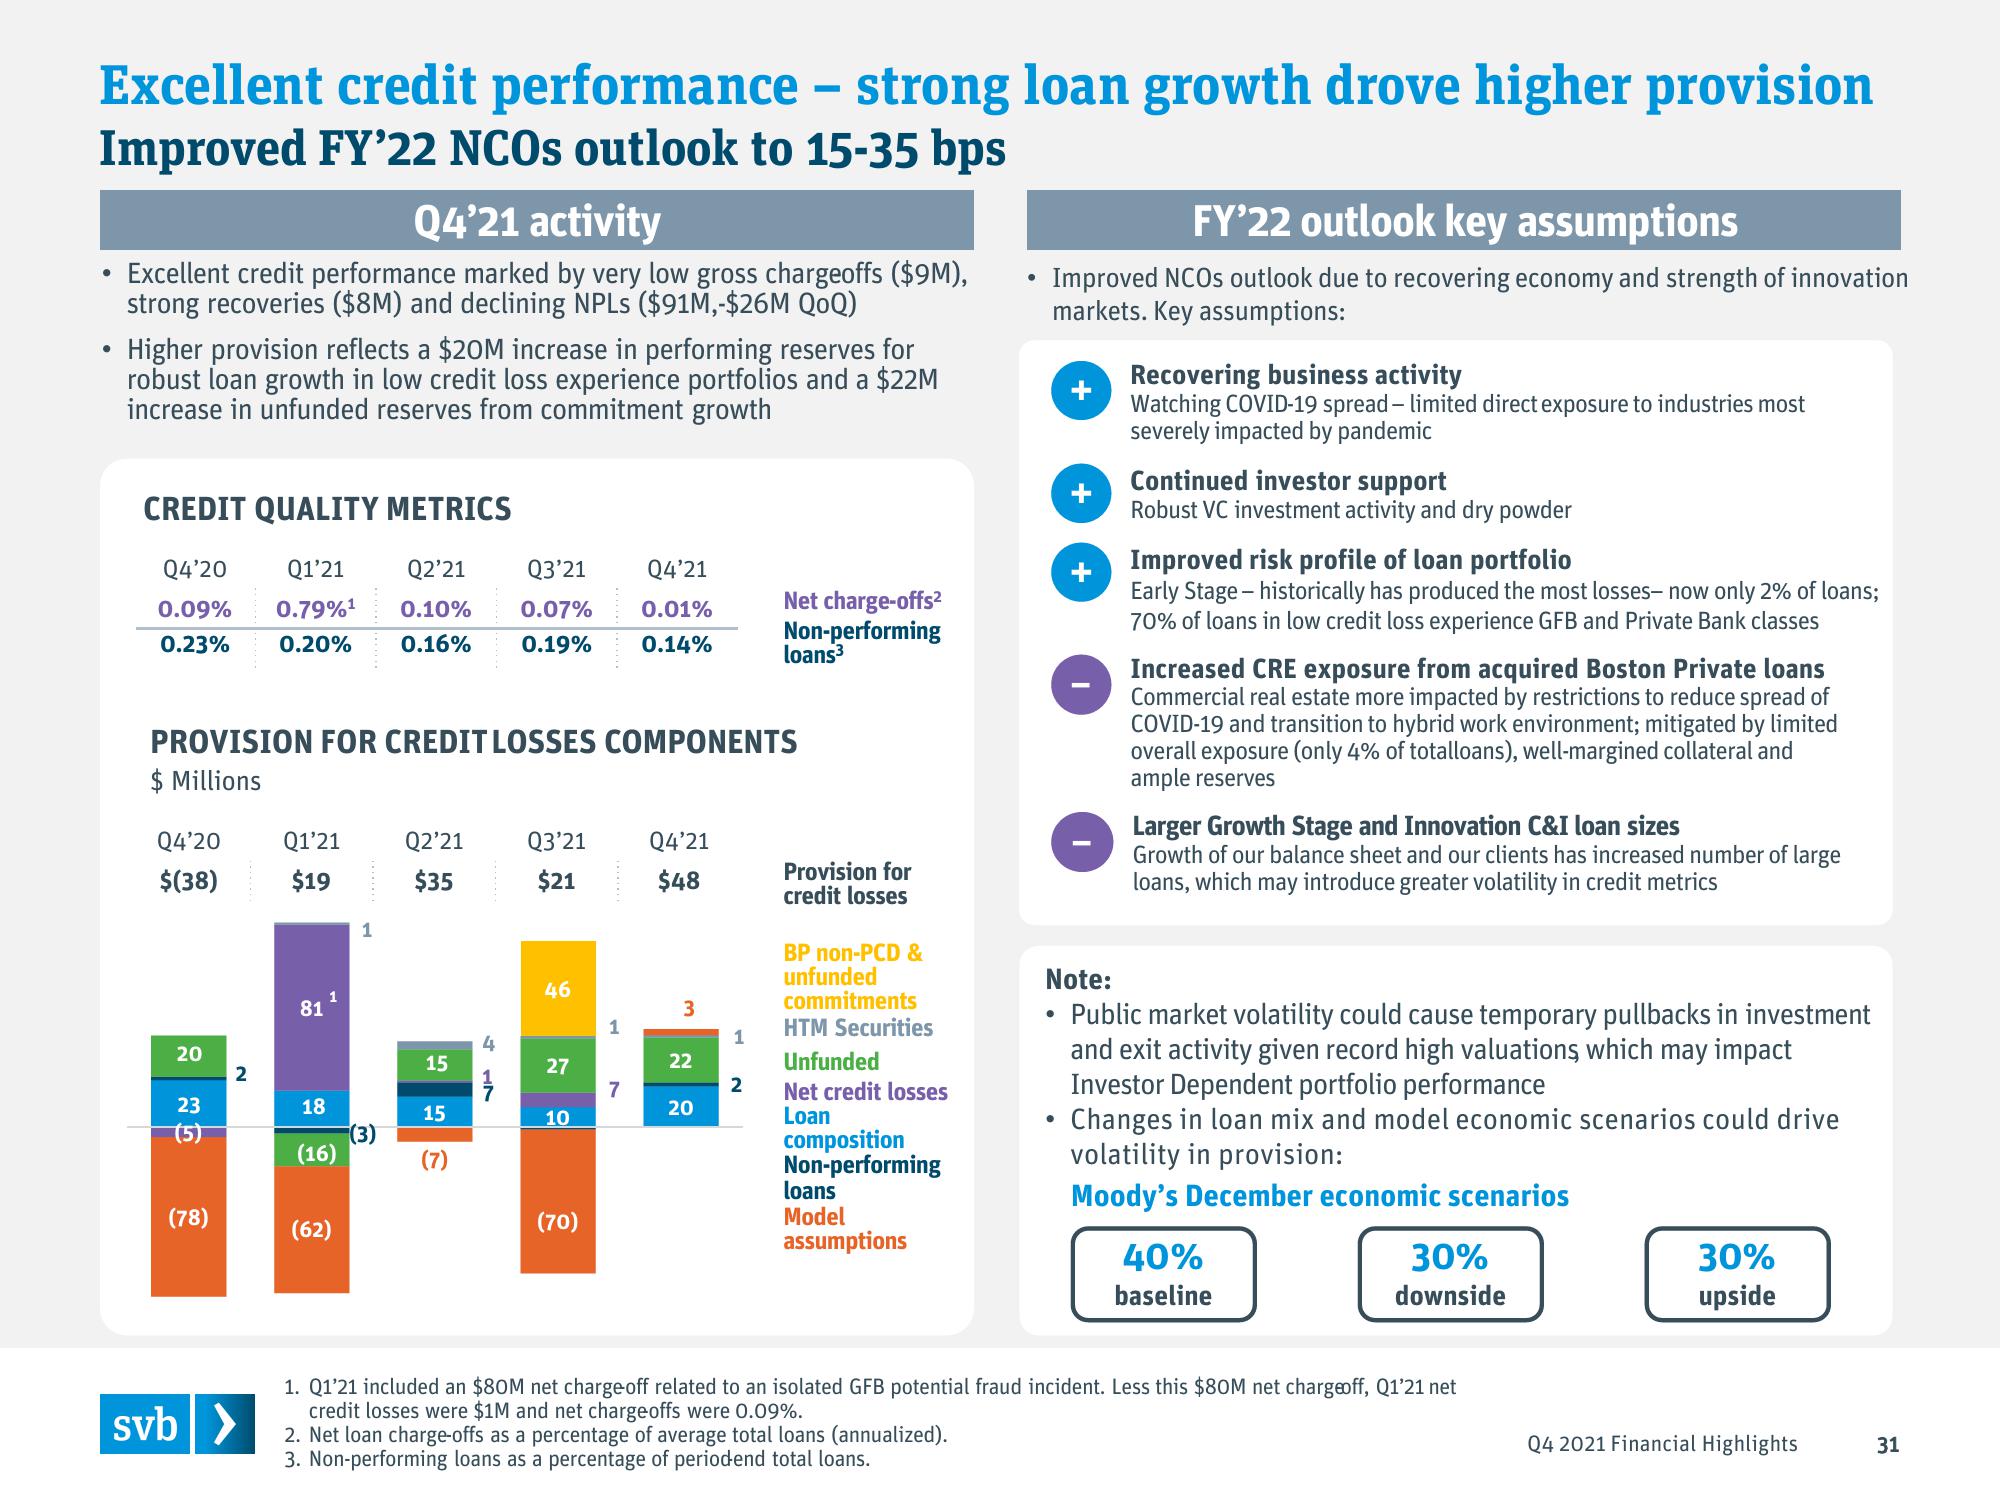
Excellent credit performance marked by very low gross chargeoffs ($9M),
strong recoveries ($8M) and declining NPLs ($91M,-$26M QoQ)
Higher provision reflects a $20M increase in performing reserves for
robust loan growth in low credit loss experience portfolios and a $22M
increase in unfunded reserves from commitment growth
CREDIT QUALITY METRICS
Q4'20
Q1'21
0.09%
0.79%¹
0.23% 0.20%
Q4'20 Q1'21
$(38)
$19
20
PROVISION FOR CREDIT LOSSES COMPONENTS
$ Millions
23
(5)
(78)
2
svb >
81
1
18
(16)
(62)
1
Q2'21
0.10%
0.16%
(3)
Q2'21
$35
15
15
Q4'21
Q3'21
0.07%
0.01%
0.19% 0.14%
4
1
Q3'21
$21
46
27
10
(70)
1
7
Q4'21
$48
3
22
20
1
Net charge-offs²
Non-performing
loans³
2
Provision for
credit losses
BP non-PCD &
unfunded
commitments
HTM Securities
Unfunded
Net credit losses
Loan
composition
Non-performing
loans
Model
assumptions
●
2. Net loan charge-offs as a percentage of average total loans (annualized).
3. Non-performing loans as a percentage of periodend total loans.
FY'22 outlook key assumptions
Improved NCOs outlook due to recovering economy and strength of innovation
markets. Key assumptions:
+
●
+
+
Recovering business activity
Watching COVID-19 spread-limited direct exposure to industries most
severely impacted by pandemic
Continued investor support
Robust VC investment activity and dry powder
Improved risk profile of loan portfolio
Early Stage - historically has produced the most losses- now only 2% of loans;
70% of loans in low credit loss experience GFB and Private Bank classes
Increased CRE exposure from acquired Boston Private loans
Commercial real estate more impacted by restrictions to reduce spread of
COVID-19 and transition to hybrid work environment; mitigated by limited
overall exposure (only 4% of totalloans), well-margined collateral and
ample reserves
Larger Growth Stage and Innovation C&I loan sizes
Growth of our balance sheet and our clients has increased number of large
loans, which may introduce greater volatility in credit metrics
Note:
Public market volatility could cause temporary pullbacks in investment
and exit activity given record high valuations which may impact
Investor Dependent portfolio performance
Changes in loan mix and model economic scenarios could drive
volatility in provision:
Moody's December economic scenarios
40%
baseline
30%
downside
1. Q1'21 included an $80M net charge off related to an isolated GFB potential fraud incident. Less this $80M net chargeoff, Q1'21 net
credit losses were $1M and net chargeoffs were 0.09%.
30%
upside
Q4 2021 Financial Highlights
31View entire presentation