Silicon Valley Bank Results Presentation Deck
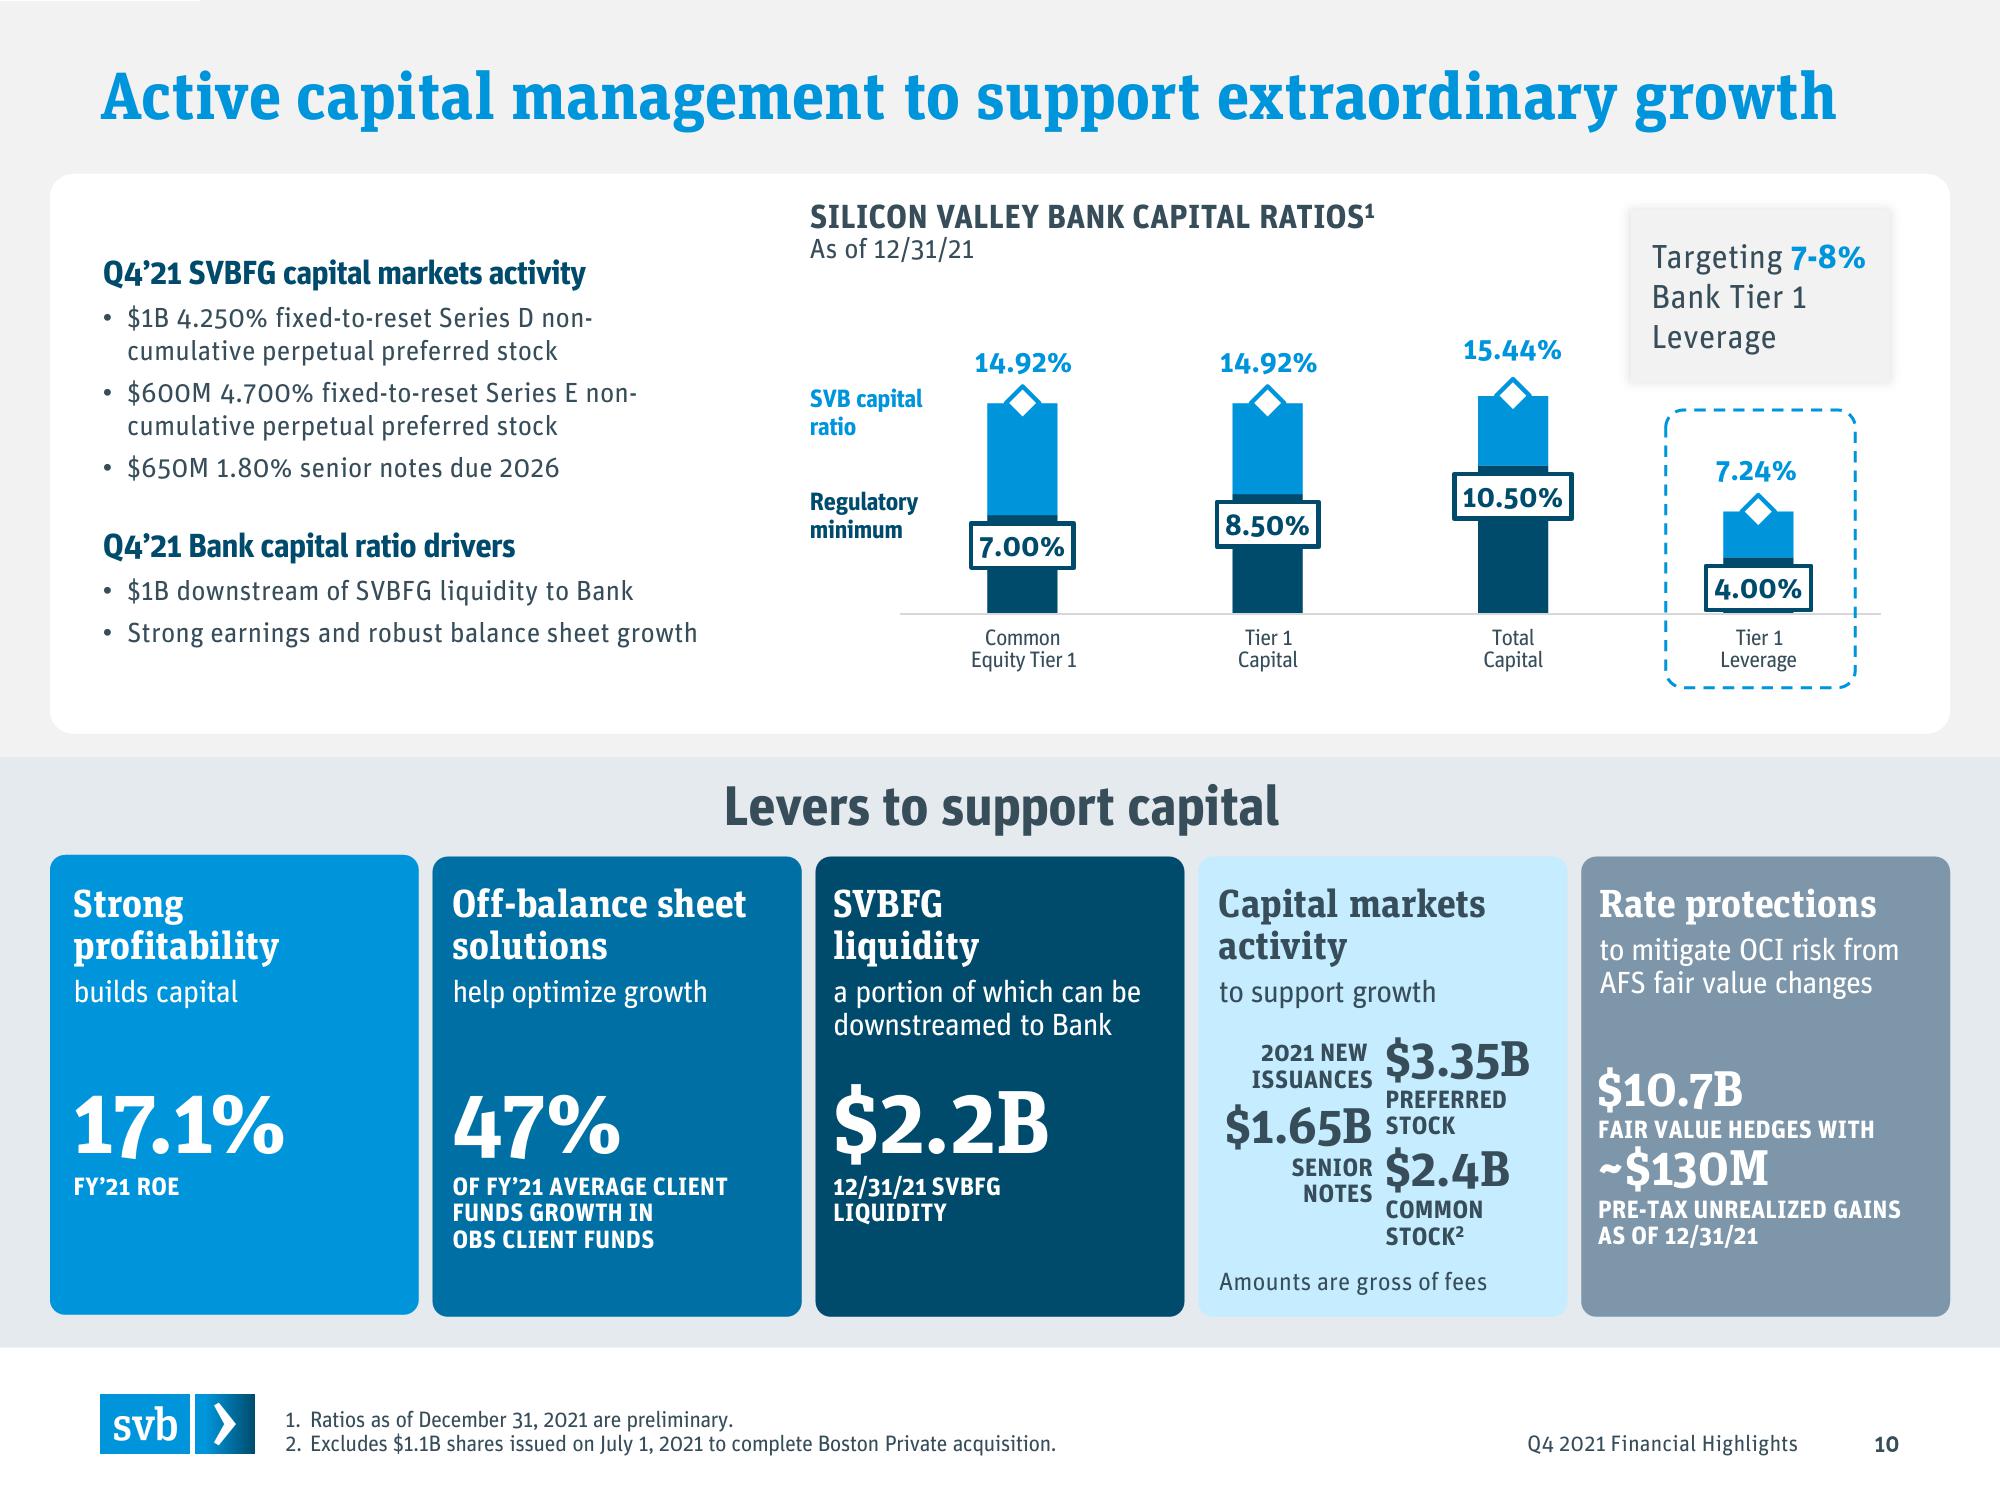
Active capital management to support extraordinary growth
SILICON VALLEY BANK CAPITAL RATIOS¹
As of 12/31/21
Q4'21 SVBFG capital markets activity
$1B 4.250% fixed-to-reset Series D non-
cumulative perpetual preferred stock
•
●
●
Q4'21 Bank capital ratio drivers
$1B downstream of SVBFG liquidity to Bank
Strong earnings and robust balance sheet growth
●
$600M 4.700% fixed-to-reset Series E non-
cumulative perpetual preferred stock
$650M 1.80% senior notes due 2026
●
Strong
profitability
builds capital
17.1%
FY'21 ROE
svb >
Off-balance sheet
solutions
help optimize growth
SVB capital
ratio
47%
OF FY'21 AVERAGE CLIENT
FUNDS GROWTH IN
OBS CLIENT FUNDS
Regulatory
minimum
14.92%
7.00%
Common
Equity Tier 1
Levers to support capital
SVBFG
liquidity
a portion of which can be
downstreamed to Bank
$2.2B
12/31/21 SVBFG
LIQUIDITY
14.92%
1. Ratios as of December 31, 2021 are preliminary.
2. Excludes $1.1B shares issued on July 1, 2021 to complete Boston Private acquisition.
8.50%
Tier 1
Capital
15.44%
10.50%
Total
Capital
Capital markets
activity
to support growth
$1.65B STOCK
2021 NEW $3.35B
ISSUANCES
PREFERRED
SENIOR $2.4B
NOTES
COMMON
STOCK²
Amounts are gross of fees
Targeting 7-8%
Bank Tier 1
Leverage
7.24%
4.00%
Tier 1
Leverage
I
Rate protections
to mitigate OCI risk from
AFS fair value changes
$10.7B
FAIR VALUE HEDGES WITH
-$130M
PRE-TAX UNREALIZED GAINS
AS OF 12/31/21
Q4 2021 Financial Highlights
10View entire presentation