Silicon Valley Bank Results Presentation Deck
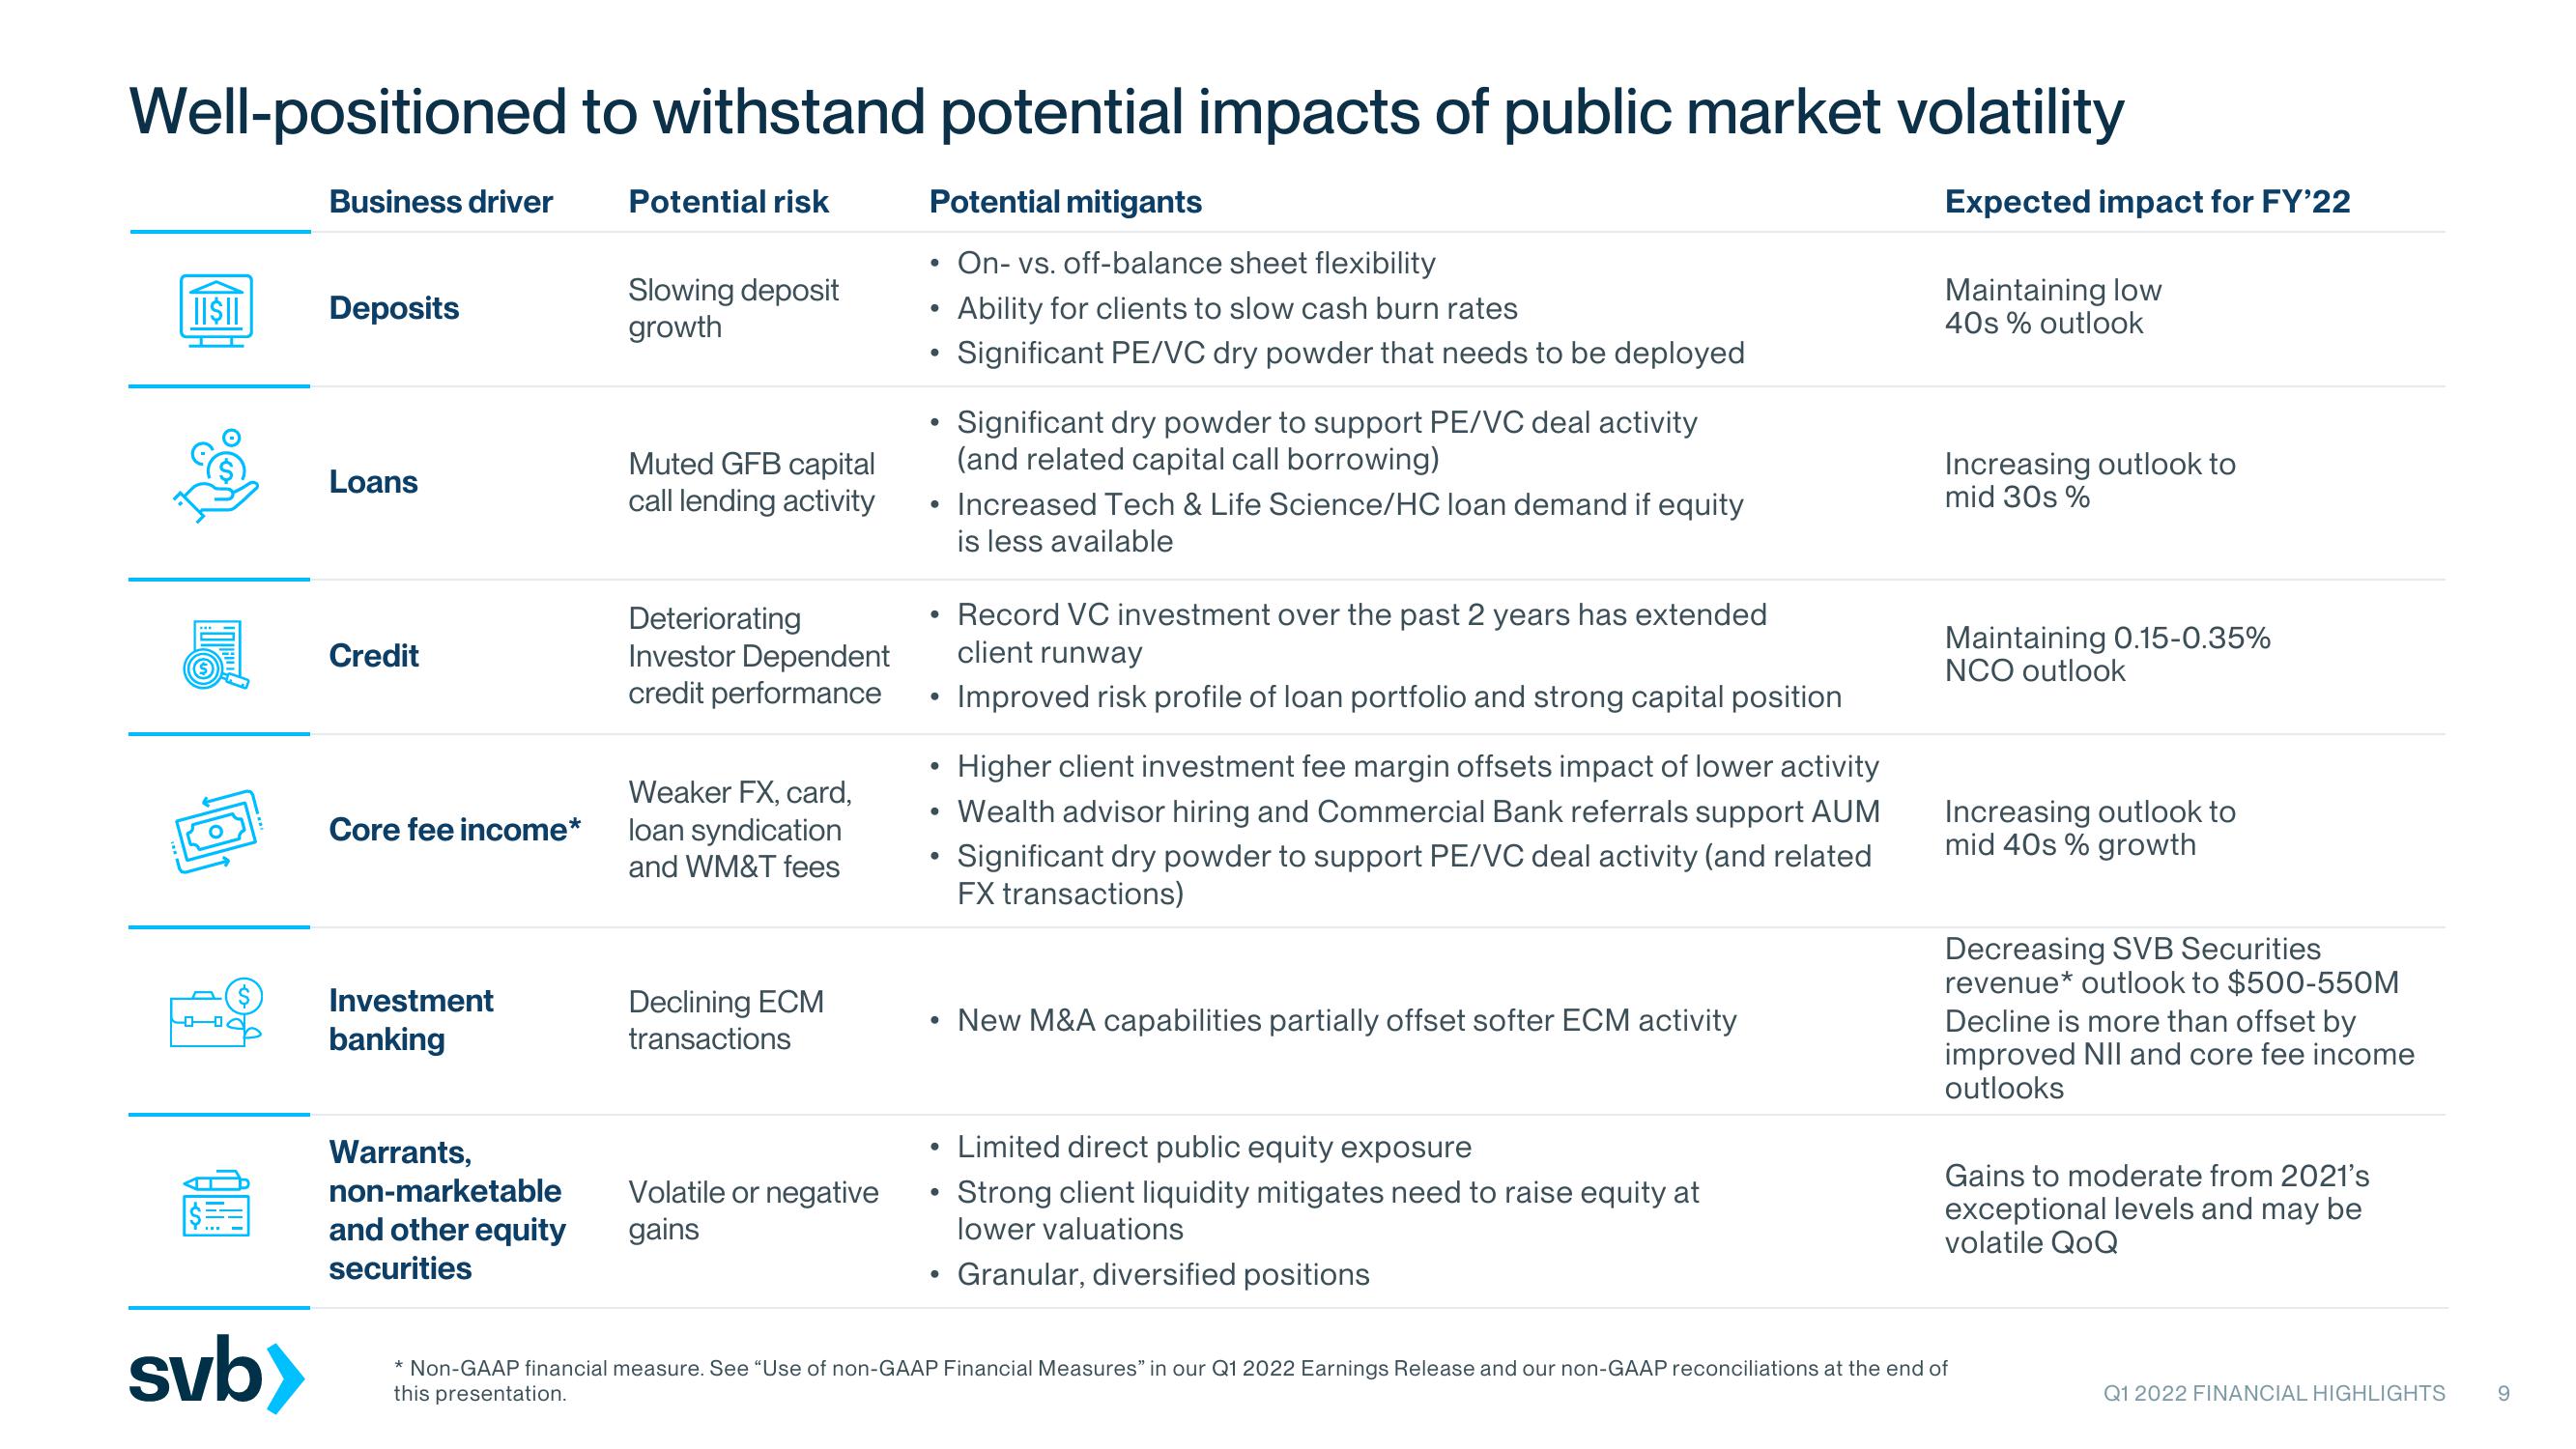
Well-positioned to withstand potential impacts of public market volatility
Potential risk
||$||
$
2
svb>
Business driver
Deposits
Loans
Credit
Core fee income*
Investment
banking
Warrants,
non-marketable
and other equity
securities
Slowing deposit
growth
Muted GFB capital
call lending activity
Deteriorating
Investor Dependent
credit performance
Weaker FX, card,
loan syndication
and WM&T fees
Declining ECM
transactions
Volatile or negative
gains
Potential mitigants
On- vs. off-balance sheet flexibility
Ability for clients to slow cash burn rates
Significant PE/VC dry powder that needs to be deployed
●
●
●
●
●
●
●
●
●
●
●
●
Significant dry powder to support PE/VC deal activity
(and related capital call borrowing)
Increased Tech & Life Science/HC loan demand if equity
is less available
Record VC investment over the past 2 years has extended
client runway
Improved risk profile of loan portfolio and strong capital position
Higher client investment fee margin offsets impact of lower activity
Wealth advisor hiring and Commercial Bank referrals support AUM
Significant dry powder to support PE/VC deal activity (and related
FX transactions)
New M&A capabilities partially offset softer ECM activity
Limited direct public equity exposure
Strong client liquidity mitigates need to raise equity at
lower valuations
Granular, diversified positions
Expected impact for FY'22
Maintaining low
40s % outlook
Increasing outlook to
mid 30s %
Maintaining 0.15-0.35%
NCO outlook
Increasing outlook to
mid 40s % growth
Decreasing SVB Securities
revenue* outlook to $500-550M
Decline is more than offset by
improved NII and core fee income
outlooks
Gains to moderate from 2021's
exceptional levels and may be
volatile QoQ
* Non-GAAP financial measure. See "Use of non-GAAP Financial Measures" in our Q1 2022 Earnings Release and our non-GAAP reconciliations at the end of
this presentation.
Q1 2022 FINANCIAL HIGHLIGHTS
9View entire presentation