Silicon Valley Bank Results Presentation Deck
Increasing diversity, equity and inclusion ("DEI") at SVB
Embracing diverse perspectives and fostering a culture of belonging
1
Start with
values and
culture
3
Measure and
communicate
progress
svb>
We start with EMPATHY for others.
We speak & act withINTEGRITY.
We embrace DIVERSE perspectives.
We take RESPONSIBILITY.
We keep LEARNING & IMPROVING
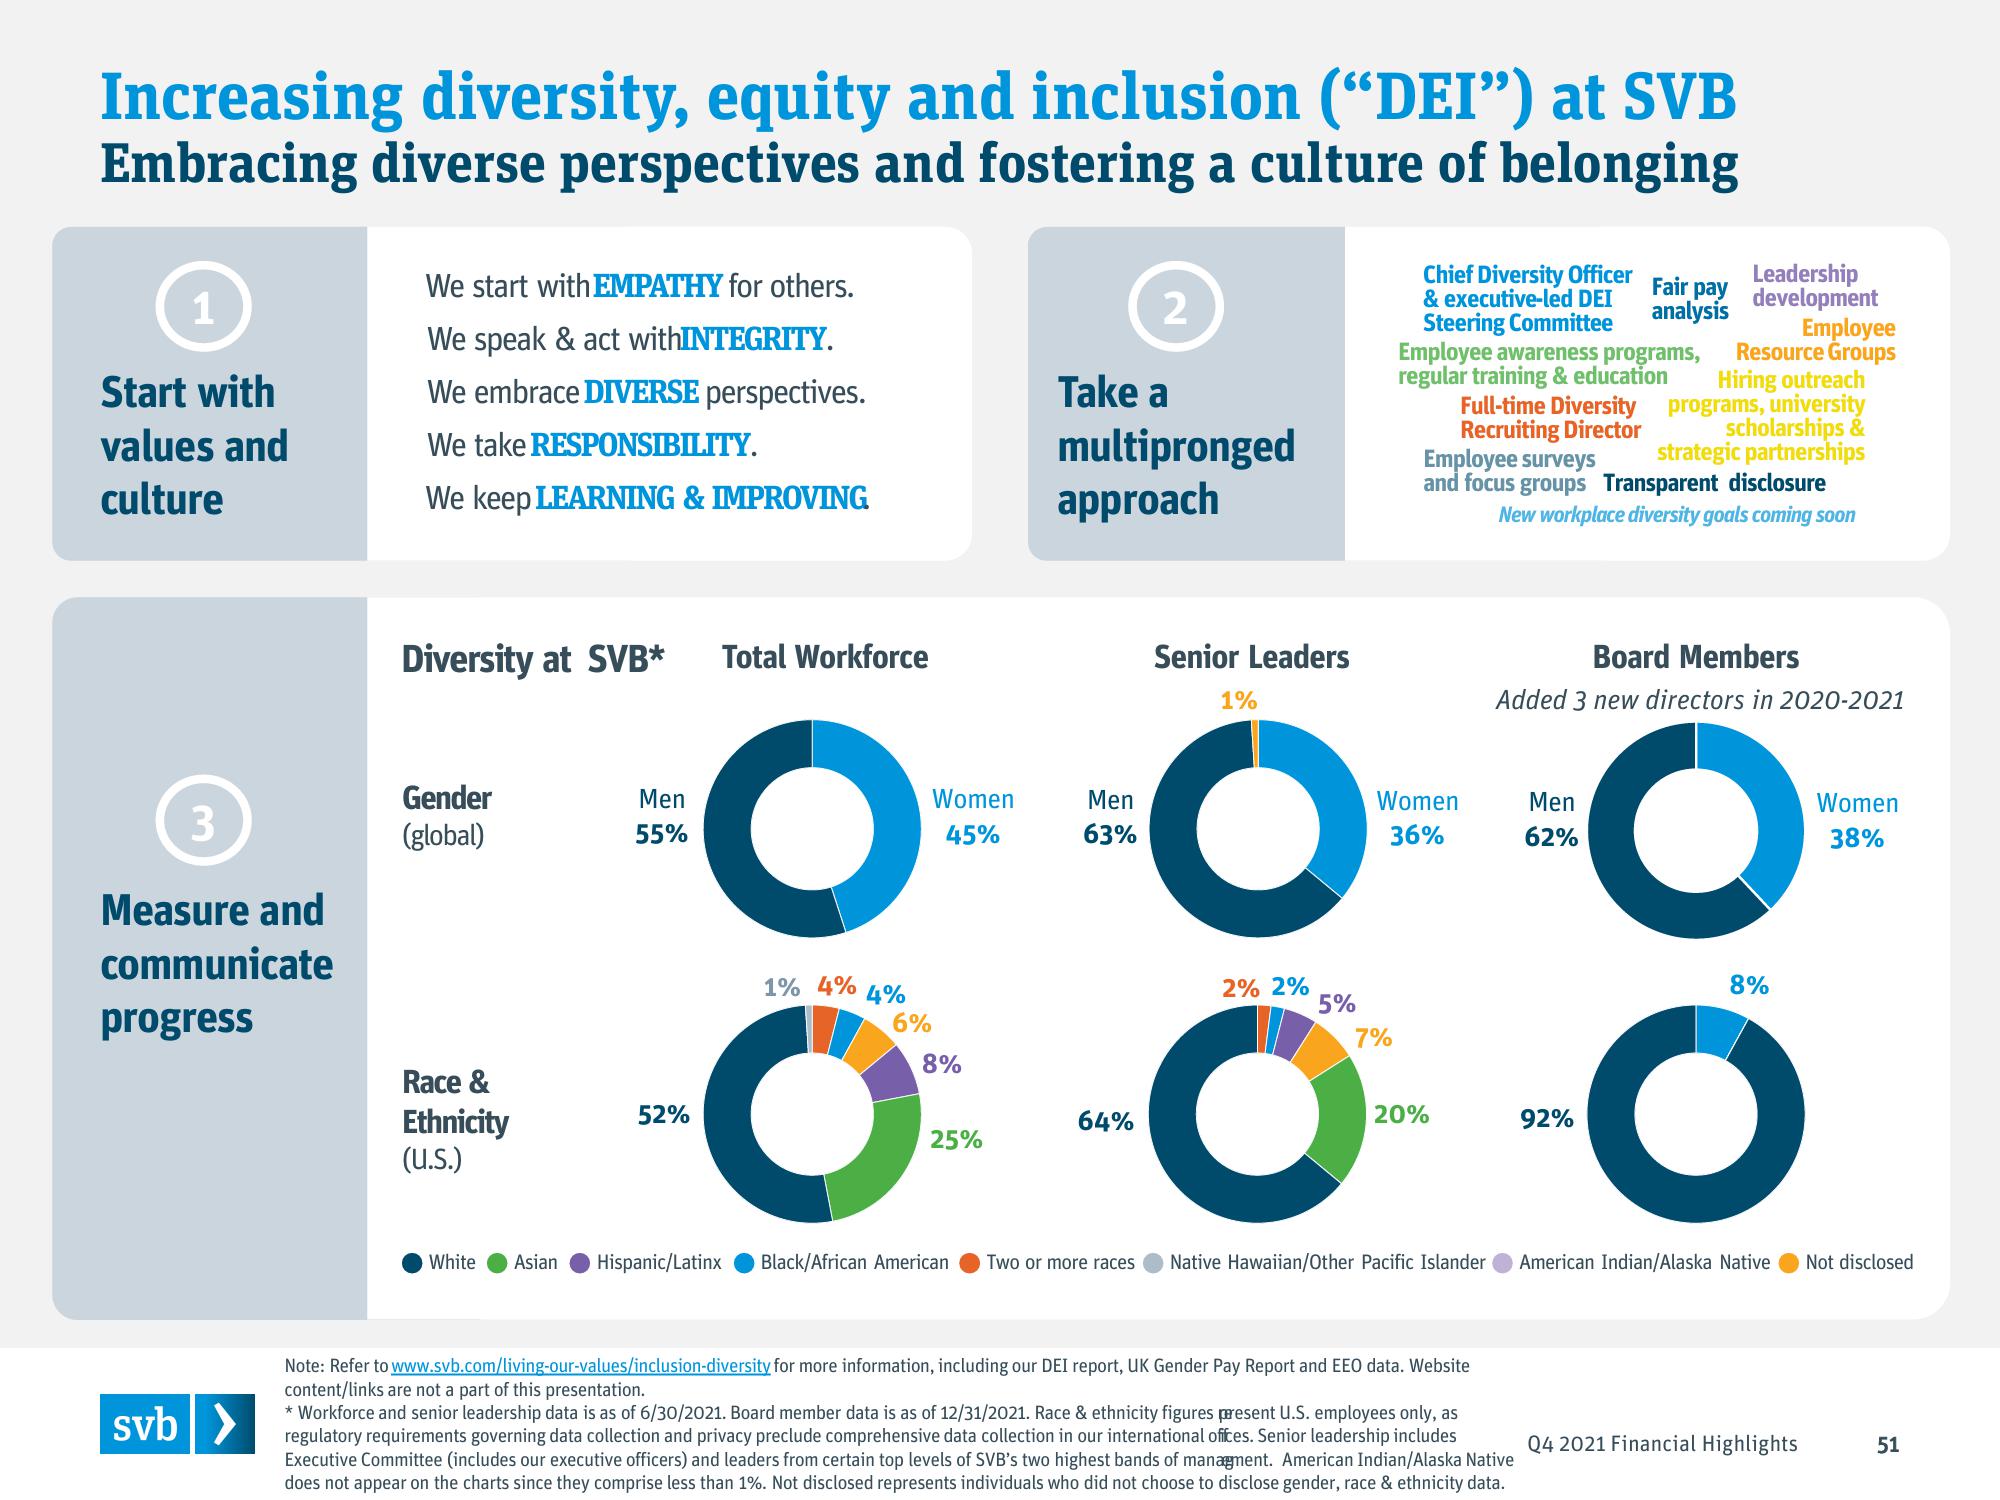
Diversity at SVB*
Gender
(global)
Race &
Ethnicity
(u.s.)
White
Men
55%
Total Workforce
52%
O
1% 4%
4%
6%
O
Black/African American
Women
45%
Asian Hispanic/Latinx
8%
25%
2
Take a
multipronged
approach
Men
63%
64%
Two or more races
Senior Leaders
1%
O
2% 2%
Chief Diversity Officer
& executive-led DEI
Steering Committee
Employee awareness programs,
regular training & education
Full-time Diversity
Recruiting Director
Employee surveys
and focus groups Transparent disclosure
New workplace diversity goals coming soon
Women
36%
5%
7%
20%
Native Hawaiian/Other Pacific Islander
Note: Refer to www.svb.com/living-our-values/inclusion-diversity for more information, including our DEI report, UK Gender Pay Report and EEO data. Website
content/links are not a part of this presentation.
* Workforce and senior leadership data is as of 6/30/2021. Board member data is as of 12/31/2021. Race & ethnicity figures present U.S. employees only, as
regulatory requirements governing data collection and privacy preclude comprehensive data collection in our international offices. Senior leadership includes
Executive Committee (includes our executive officers) and leaders from certain top levels of SVB's two highest bands of managment. American Indian/Alaska Native
does not appear on the charts since they comprise less than 1%. Not disclosed represents individuals who did not choose to disclose gender, race & ethnicity data.
Leadership
development
Employee
Resource Groups
Hiring outreach
programs, university
Men
62%
Board Members
Added 3 new directors in 2020-2021
O
92%
Fair
pay
analysis
scholarships &
strategic partnerships
8%
O
American Indian/Alaska Native
Q4 2021 Financial Highlights
Women
38%
Not disclosed
51View entire presentation