Silicon Valley Bank Results Presentation Deck
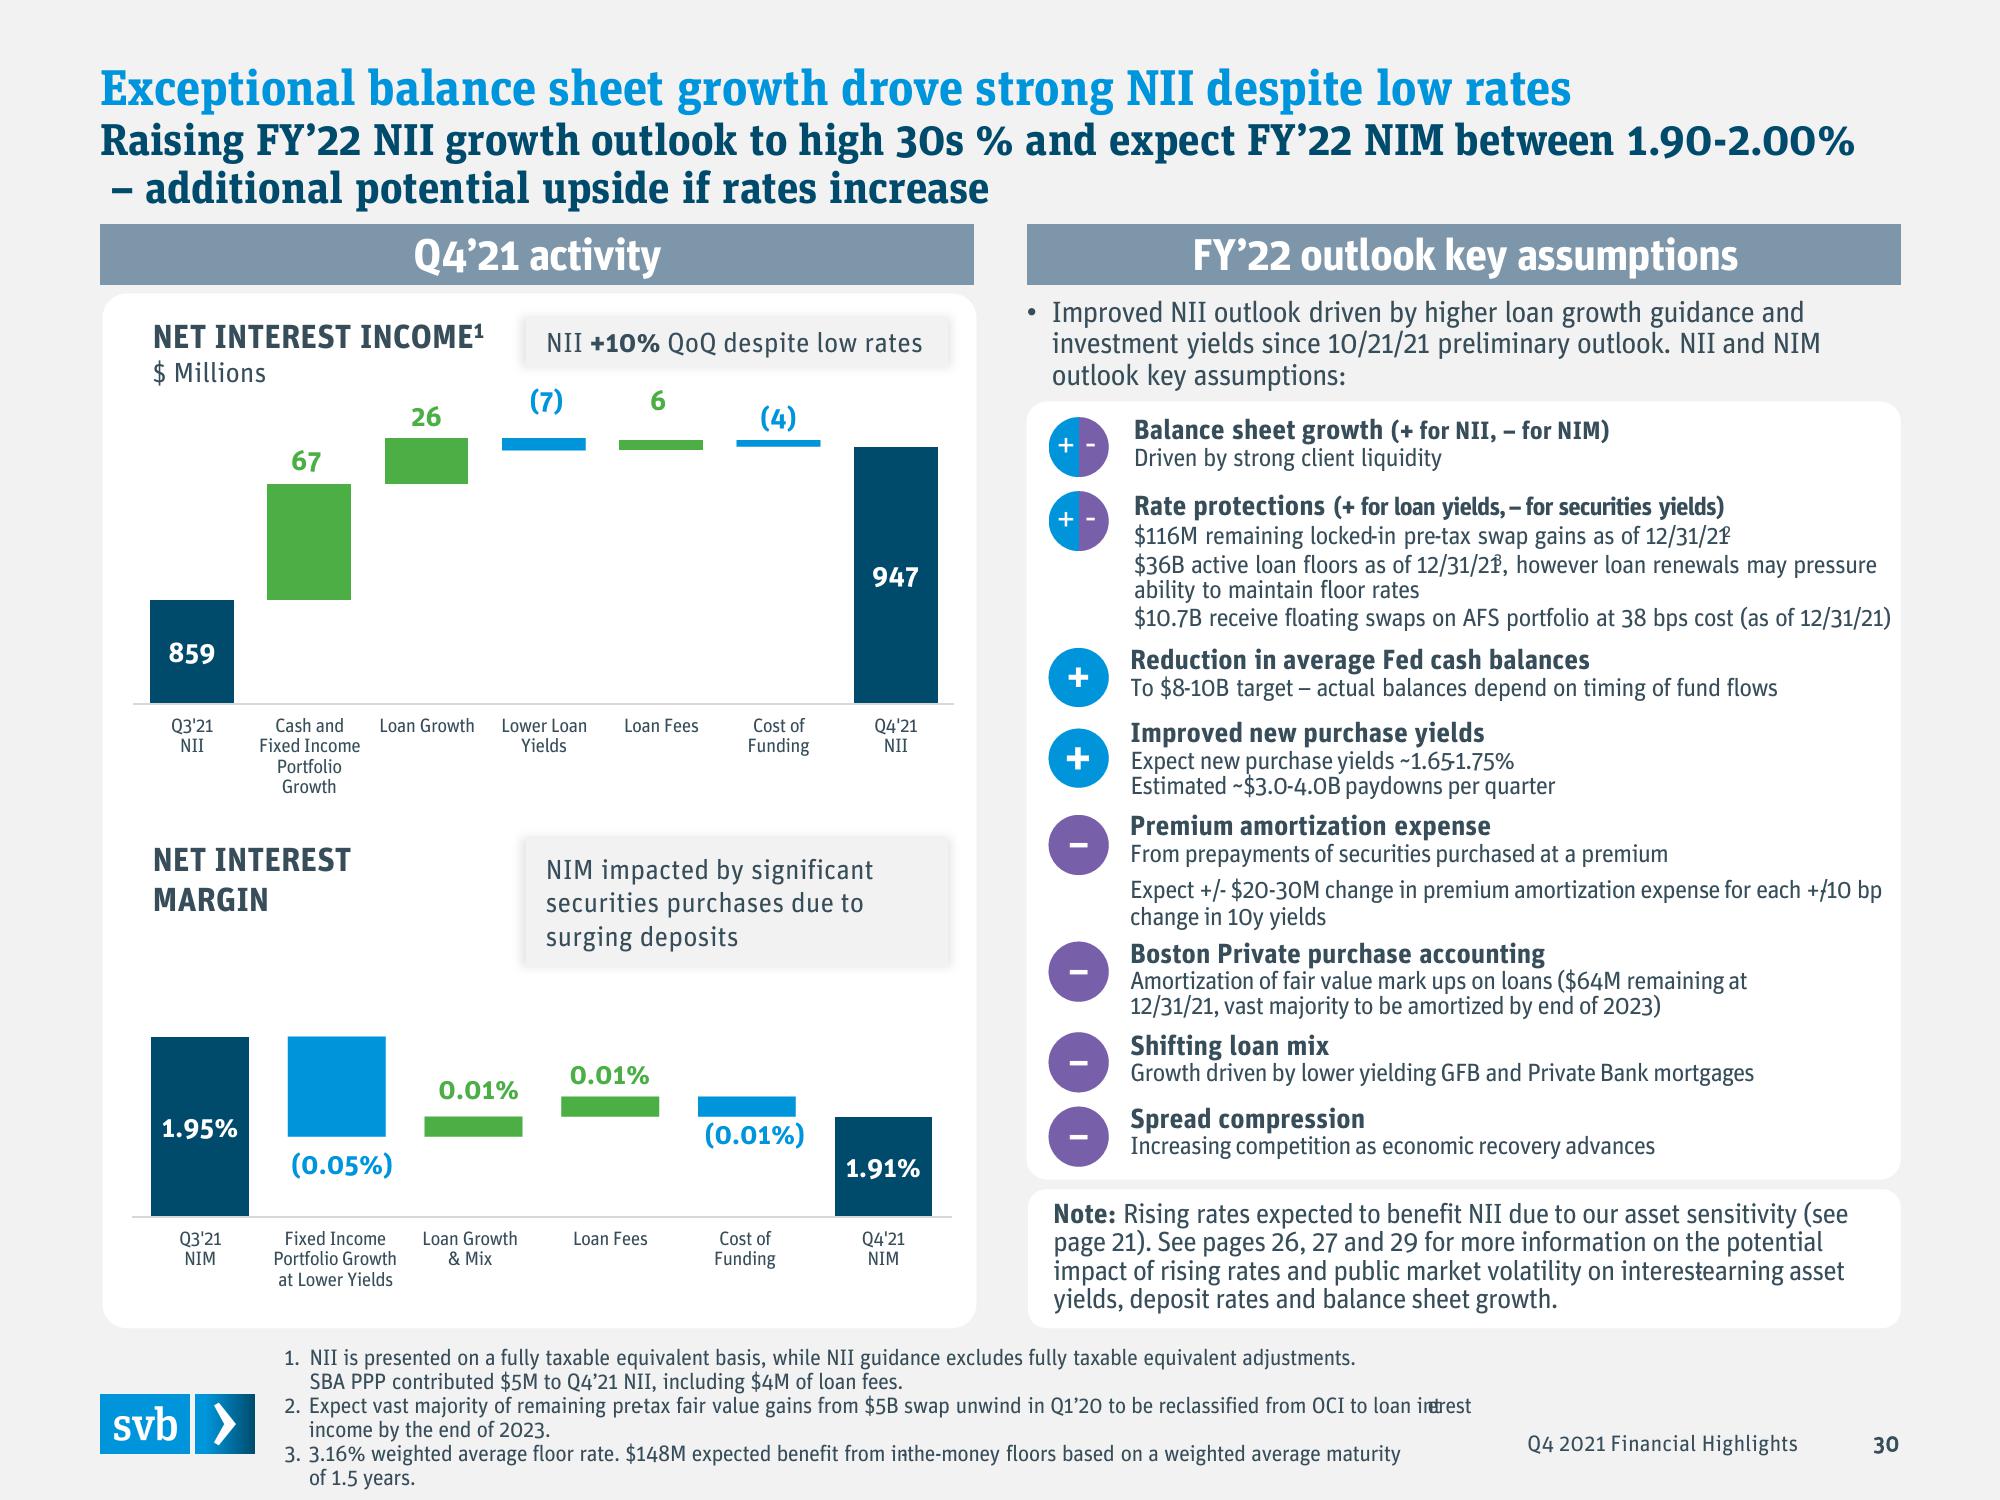
Exceptional balance sheet growth drove strong NII despite low rates
Raising FY'22 NII growth outlook to high 30s % and expect FY'22 NIM between 1.90-2.00%
– additional potential upside if rates increase
Q4'21 activity
NET INTEREST INCOME¹
$ Millions
859
Q3'21
NII
1.95%
Q3'21
NIM
67
NET INTEREST
MARGIN
svb >
Cash and
Fixed Income
Portfolio
Growth
Loan Growth
(0.05%)
26
Fixed Income
Portfolio Growth
at Lower Yields
0.01%
NII +10% QoQ despite low rates
(7)
(4)
Lower Loan Loan Fees
Yields
Loan Growth
& Mix
6
0.01%
Loan Fees
Cost of
Funding
NIM impacted by significant
securities purchases due to
surging deposits
(0.01%)
947
Cost of
Funding
Q4'21
NII
1.91%
Q4'21
NIM
FY'22 outlook key assumptions
Improved NII outlook driven by higher loan growth guidance and
investment yields since 10/21/21 preliminary outlook. NII and NIM
outlook key assumptions:
+
+
+
+
Balance sheet growth (+ for NII, - for NIM)
Driven by strong client liquidity
Rate protections (+ for loan yields,- for securities yields)
$116M remaining locked-in pre-tax swap gains as of 12/31/21
$36B active loan floors as of 12/31/21, however loan renewals may pressure
ability to maintain floor rates
$10.7B receive floating swaps on AFS portfolio at 38 bps cost (as of 12/31/21)
Reduction in average Fed cash balances
To $8-10B target - actual balances depend on timing of fund flows
Improved new purchase yields
Expect new purchase yields ~1.65-1.75%
Estimated $3.0-4.0B paydowns per quarter
Premium amortization expense
From prepayments of securities purchased at a premium
Expect +/- $20-30M change in premium amortization expense for each +/10 bp
change in 10y yields
Boston Private purchase accounting
Amortization of fair value mark ups on loans ($64M remaining at
12/31/21, vast majority to be amortized by end of 2023)
Shifting loan mix
Growth driven by lower yielding GFB and Private Bank mortgages
Spread compression
Increasing competition as economic recovery advances
Note: Rising rates expected to benefit NII due to our asset sensitivity (see
page 21). See pages 26, 27 and 29 for more information on the potential
impact of rising rates and public market volatility on interestearning asset
yields, deposit rates and balance sheet growth.
1. NII is presented on a fully taxable equivalent basis, while NII guidance excludes fully taxable equivalent adjustments.
SBA PPP contributed $5M to Q4'21 NII, including $4M of loan fees.
2. Expect vast majority of remaining pretax fair value gains from $5B swap unwind in Q1'20 to be reclassified from OCI to loan intrest
income by the end of 2023.
3. 3.16% weighted average floor rate. $148M expected benefit from inthe-money floors based on a weighted average maturity
of 1.5 years.
Q4 2021 Financial Highlights
30View entire presentation