Apollo Global Management Investor Presentation Deck
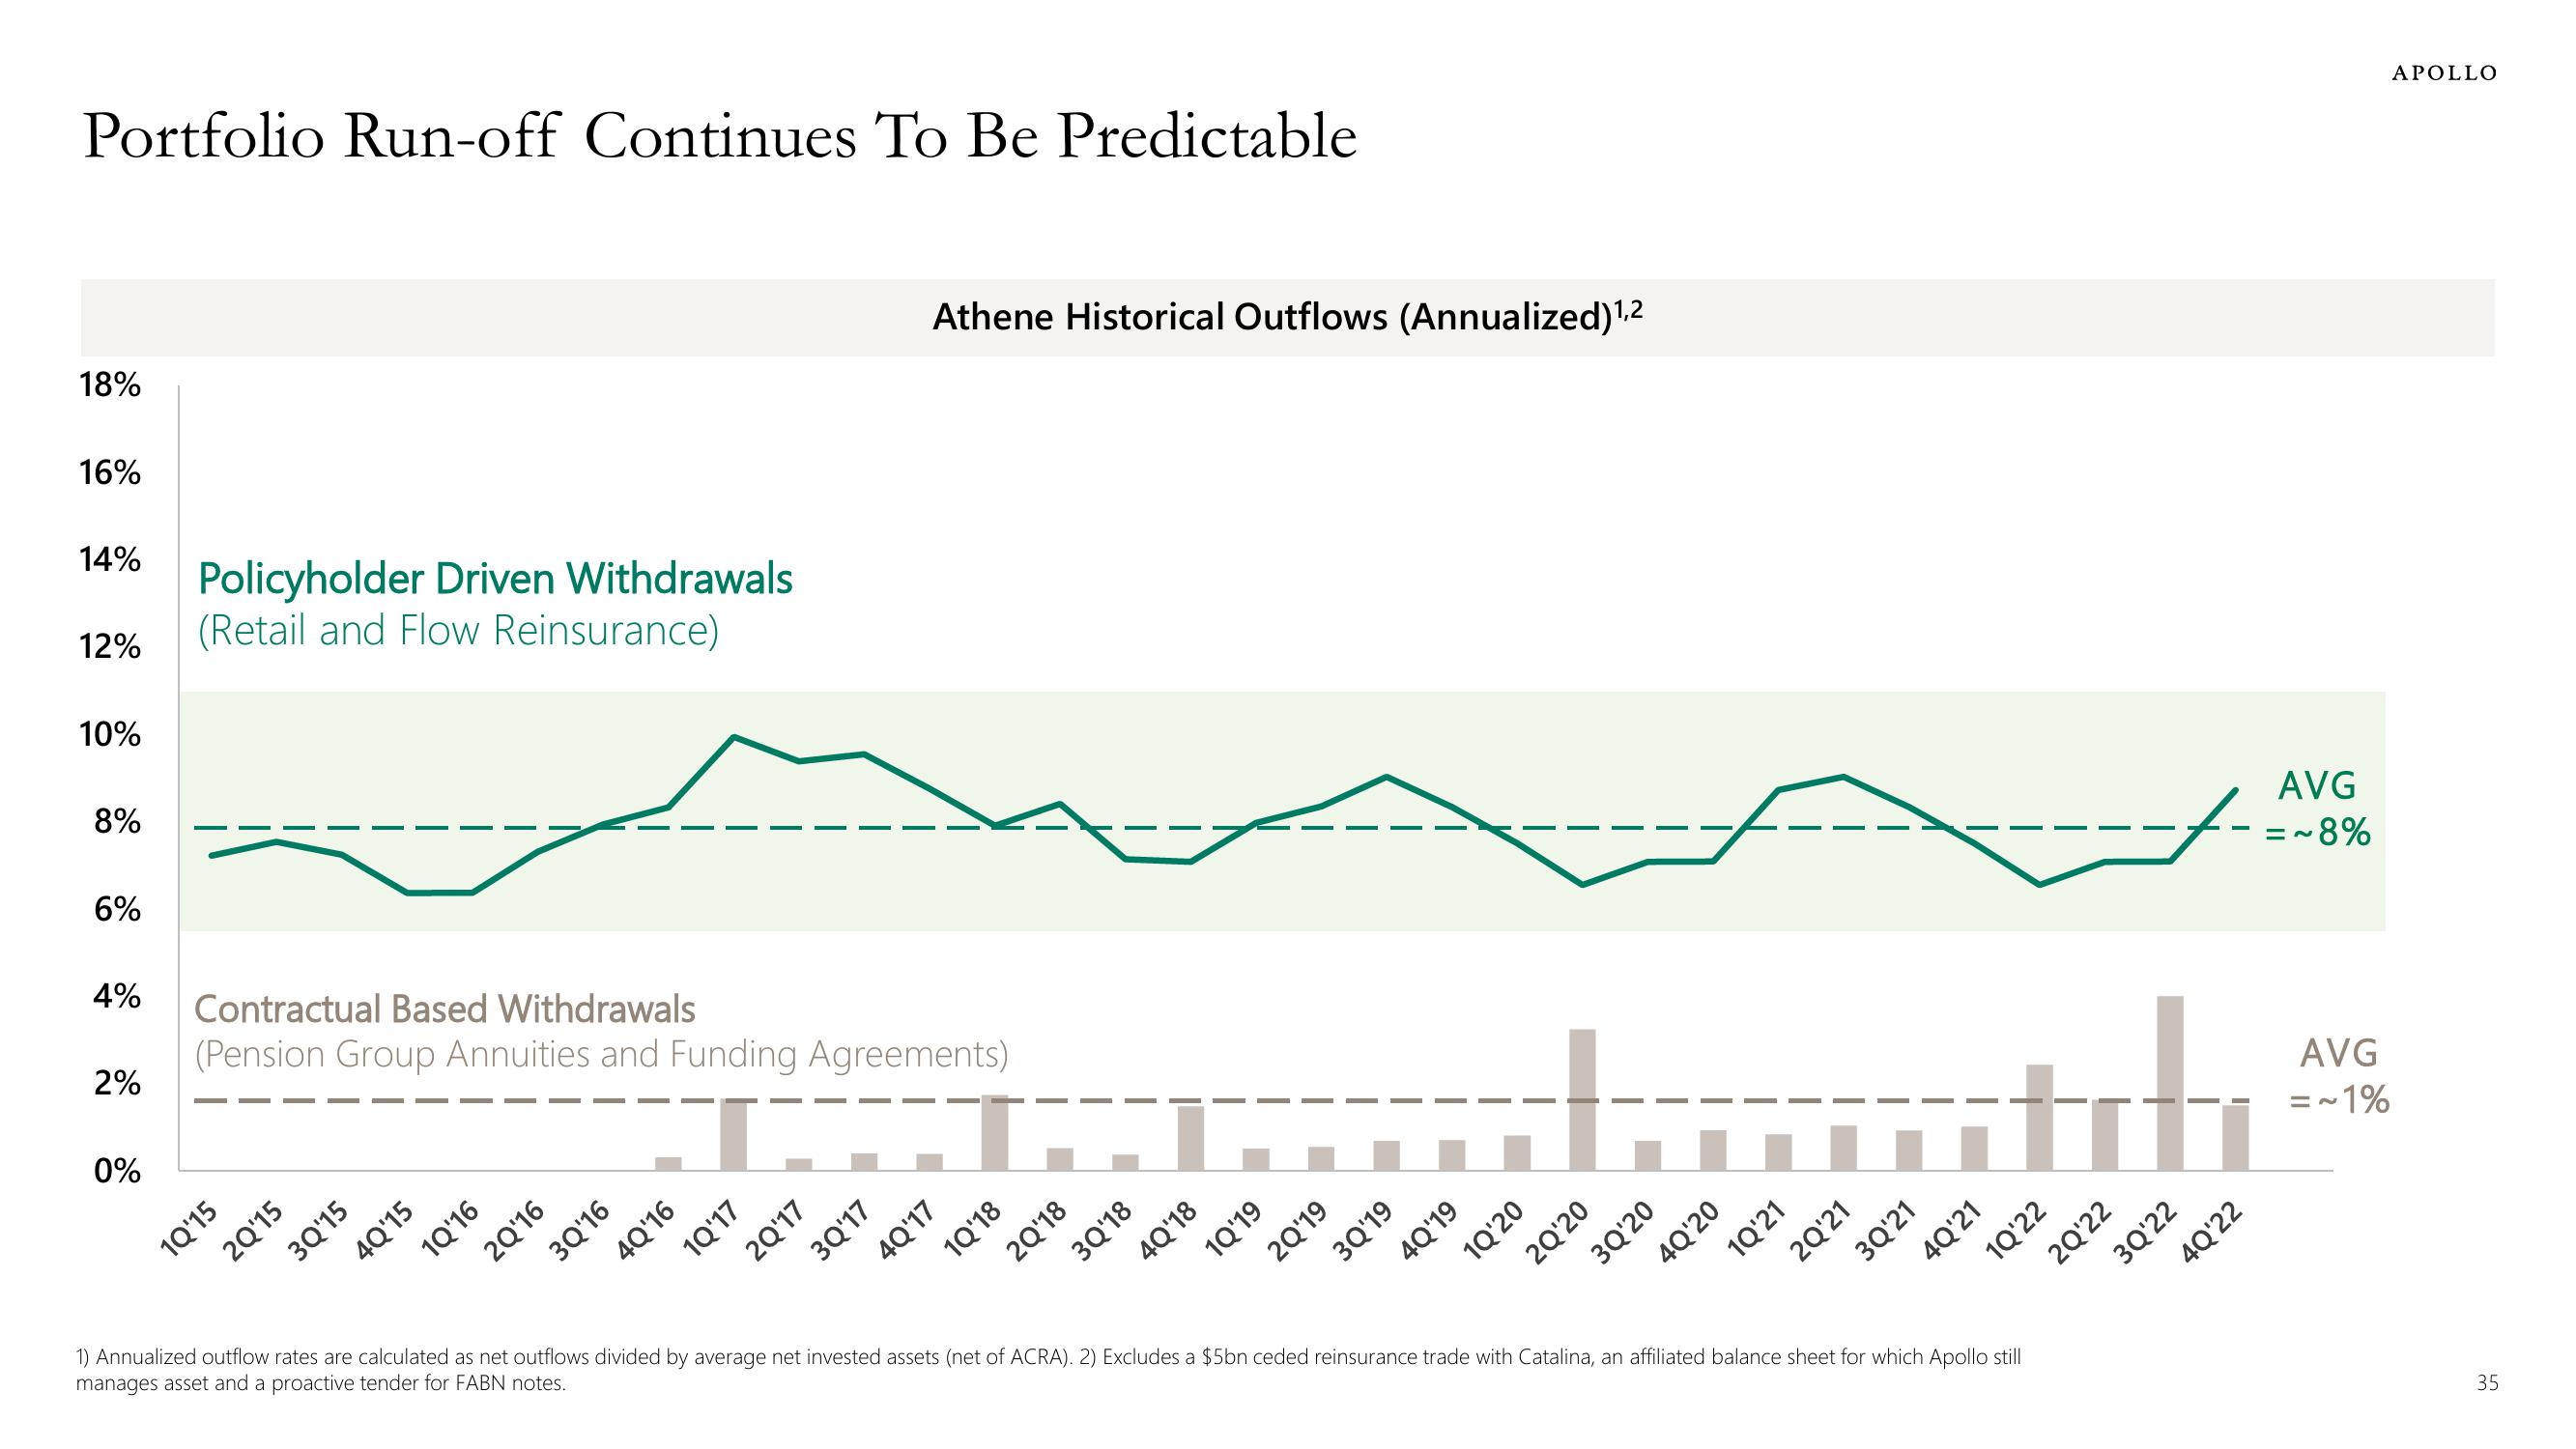
Portfolio Run-off Continues To Be Predictable
18%
16%
14%
12%
10%
8%
6%
4%
2%
0%
Policyholder Driven Withdrawals
(Retail and Flow Reinsurance)
Contractual Based Withdrawals
(Pension Group Annuities and Funding Agreements)
1Q'15
2Q'15
3Q'15
4Q'15
1Q'16
2Q¹16
3Q'16
4Q'16
1Q'17
2Q'17
Athene Historical Outflows (Annualized)¹,2
3Q'17
4Q'17
1Q'18
2Q'18
3Q'18
4Q'18
1Q'19
2Q'19
3Q'19
4Q'19
da
1Q'20
2Q'20
3Q'20
4Q'20
1Q'21
2Q¹21
3Q'21
it
4Q'21
1Q'22
1) Annualized outflow rates are calculated as net outflows divided by average net invested assets (net of ACRA). 2) Excludes a $5bn ceded reinsurance trade with Catalina, an affiliated balance sheet for which Apollo still
manages asset and a proactive tender for FABN notes.
2Q¹22
3Q'22
4Q'22
AVG
~8%
=~
AVG
=~1%
APOLLO
35View entire presentation